MathsFreePrintable

Data Analysis Worksheet

A free, printable maths worksheet ready for your classroom. Download instantly, print, and hand out to your students — no account needed.

Data Analysis Worksheet worksheet preview

Data Analysis Worksheet

Data analysis charts and graphs

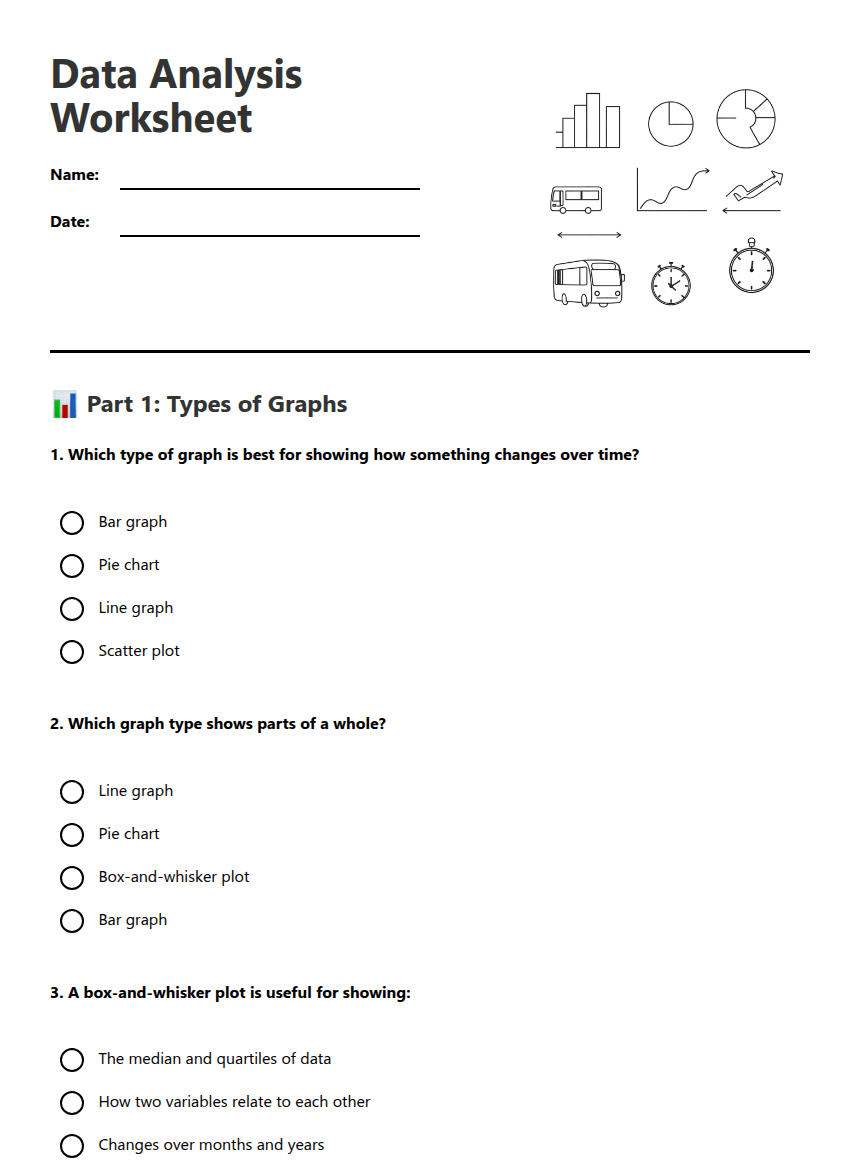
📊 Part 1: Types of Graphs

1. Which type of graph is best for showing how something changes over time?

Bar graph

Pie chart

Line graph

Scatter plot

2. Which graph type shows parts of a whole?

Line graph

Pie chart

Box-and-whisker plot

Bar graph

3. A box-and-whisker plot is useful for showing:

The median and quartiles of data

How two variables relate to each other

Changes over months and years

Different categories side by side

4. Which graph types would you use to compare the favourite sports of students in your class? (Select all that apply)

Bar graph

Pie chart

Line graph

Scatter plot

🚌 Part 2: Reading Timetables

Bus Timetable - Route 25

City Centre: 8:15am, 8:45am, 9:15am, 9:45am

Shopping Mall: 8:30am, 9:00am, 9:30am, 10:00am

School: 8:45am, 9:15am, 9:45am, 10:15am

5. How long does it take the bus to travel from City Centre to School?
6. If you need to be at school by 9:20am, what is the latest bus you can catch from City Centre?
7. Sarah catches the 8:45am bus from City Centre. What time will she arrive at the Shopping Mall?

📈 Part 3: Data Interpretation

Height and Arm Span Data (cm) for 10 Students:

Student 1: Height: 150, Arm Span: 155

Student 2: Height: 160, Arm Span: 162

Student 3: Height: 155, Arm Span: 158

Student 4: Height: 165, Arm Span: 170

Student 5: Height: 170, Arm Span: 175

Student 6: Height: 158, Arm Span: 160

Student 7: Height: 162, Arm Span: 165

Student 8: Height: 168, Arm Span: 172

Student 9: Height: 172, Arm Span: 178

Student 10: Height: 175, Arm Span: 180

8. Plot the given data on a scatter plot.
9. Draw a line of best fit for the data you plotted.
10. Identify the type of correlation shown in your scatter plot (positive, negative, or no correlation).
11. What is the outlier in this temperature data? (For reference: Temperature Data (°C): 18, 22, 19, 25, 21, 35, 20, 23)
12. Explain why this value is considered an outlier.

About This Worksheet

Free Download

No sign-up, no email, no paywall. Just download and print.

Print-Ready

Formatted for standard paper. Clean layout, easy to read.

AI-Generated

Created with Kuraplan's AI, designed for real classroom use.

For Teachers & Parents

Use in classrooms, for homework, tutoring, or homeschool.

Need a custom version of this worksheet?

Kuraplan's AI generates custom worksheets in seconds — differentiated for every learner, aligned to your curriculum.

Generate Custom Worksheets — Free
No credit card Curriculum-aligned Under 60 seconds