Line Graph Template — free printable diagram
Free maths resource for teachers · CC BY-NC 4.0
About this illustration
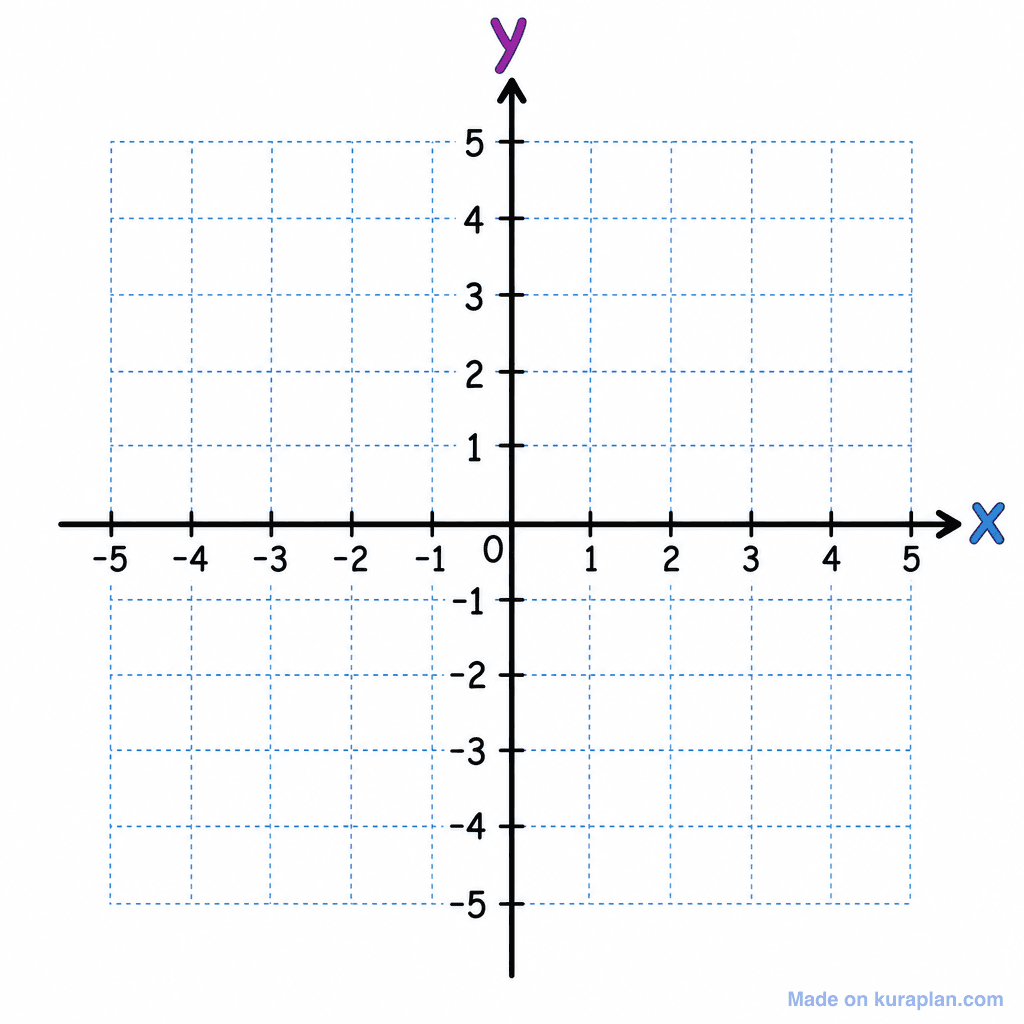
This image displays a blank Cartesian coordinate plane, commonly known as a graph grid, featuring bold black x-axis and y-axis lines. Both axes extend from -5 to 5, marked with clear numerical labels at each integer, and are identified with a blue 'x' for the horizontal axis and a purple 'y' for the vertical axis. A light blue dashed grid overlays the entire plane, providing visual reference for accurate plotting. This visual resource is ideal for teaching foundational concepts in coordinate geometry, such as plotting points, graphing linear equations, or understanding quadrants, suitable for K-12 mathematics. It serves as an excellent blank template for student worksheets, a clear graphic for slide presentations, or for interactive label exercises. The visual style is a clean, high-contrast flat illustration.
How to use
- 1Right-click the image and choose “Save image as”, or use the download button.
- 2Use it in your classroom worksheets, slides or printables — free under CC BY-NC 4.0.
- 3Attribute as “Image by Kuraplan” or link back to kuraplan.com. Not for commercial resale.
Make worksheets with images like this
Kuraplan's editor has the full image library built in — drag-and-drop into a worksheet in seconds.
Related illustrations
More from Statistics & Probability
Browse by subject
18 subjects · 3,800 free illustrations

Cross-Curricular
839 free illustrations

Science
818 free illustrations
English
625 free illustrations
Geography
553 free illustrations

Health
201 free illustrations
social_studies
178 free illustrations

Religious Education
140 free illustrations
Music
130 free illustrations
Art
66 free illustrations

Drama
56 free illustrations
social_sciences
48 free illustrations
History
47 free illustrations
arts
26 free illustrations

pe
25 free illustrations
te_reo_maori
24 free illustrations
tech
16 free illustrations
culture
7 free illustrations

languages
1 free illustrations