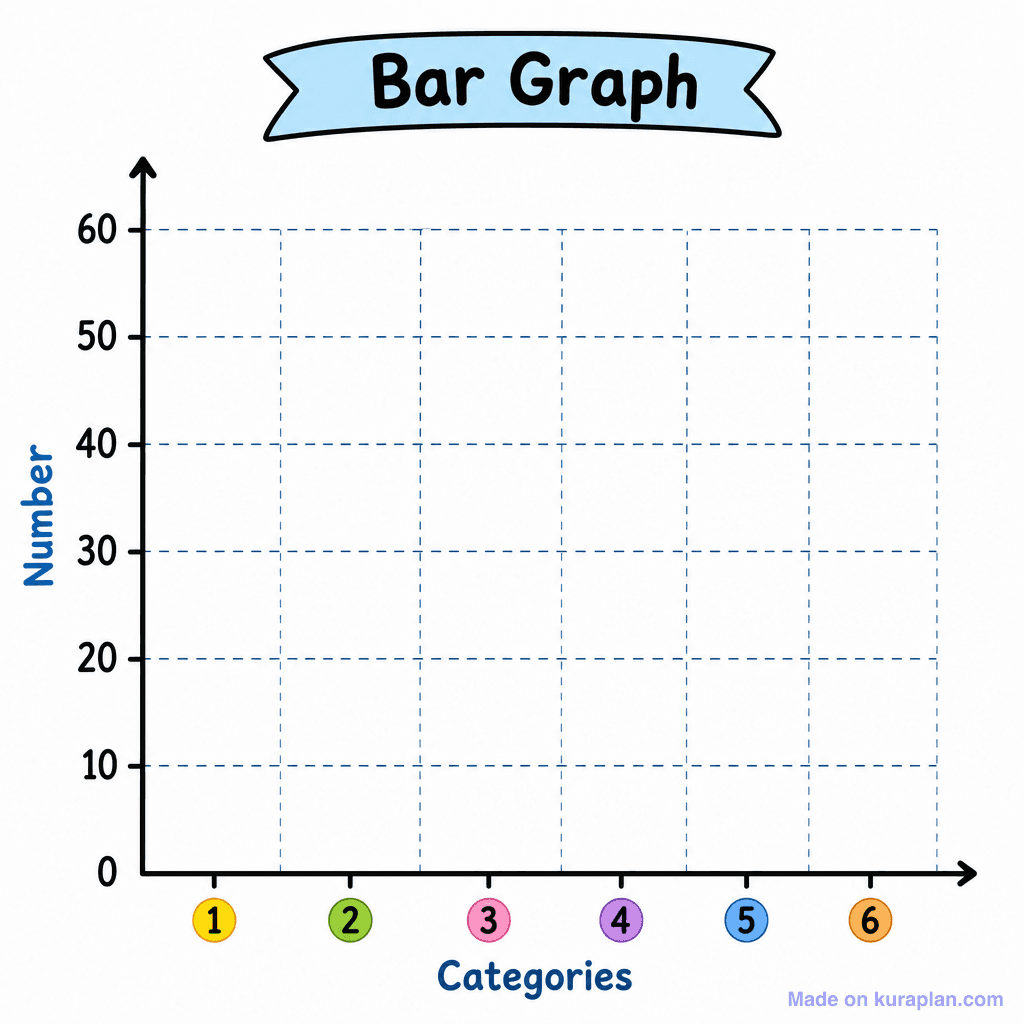
Bar Chart Vertical Template — free printable diagram
Free maths resource for teachers · CC BY-NC 4.0
About this illustration
This image presents a blank bar graph template, ideal for K-6 mathematics lessons on data representation. It features a y-axis scaled from 0 to 60, labeled "Number," and an x-axis labeled "Categories," displaying six distinct categories marked with numbers 1 through 6 in colorful circles. A light blue banner at the top explicitly states "Bar Graph." The design is a clean, flat illustration with a guiding dashed grid, perfectly suited for student activities like plotting data on worksheets, interactive slide presentations, or as a blank template for a graphing exercise.
How to use
- 1Right-click the image and choose “Save image as”, or use the download button.
- 2Use it in your classroom worksheets, slides or printables — free under CC BY-NC 4.0.
- 3Attribute as “Image by Kuraplan” or link back to kuraplan.com. Not for commercial resale.
Make worksheets with images like this
Kuraplan's editor has the full image library built in — drag-and-drop into a worksheet in seconds.
Related illustrations
More from Statistics & Probability
Browse by subject
18 subjects · 3,772 free illustrations
Cross-Curricular
835 free illustrations
Science
816 free illustrations
English
612 free illustrations
Geography
549 free illustrations
Health
200 free illustrations
social_studies
177 free illustrations
Religious Education
139 free illustrations
Music
128 free illustrations
Art
66 free illustrations
Drama
56 free illustrations
social_sciences
48 free illustrations
History
47 free illustrations
arts
26 free illustrations
pe
25 free illustrations
te_reo_maori
24 free illustrations
tech
16 free illustrations
culture
7 free illustrations
languages
1 free illustrations