Contour Cross Section Diagram — free printable diagram
Free geography resource for teachers · CC BY-NC 4.0
About this illustration
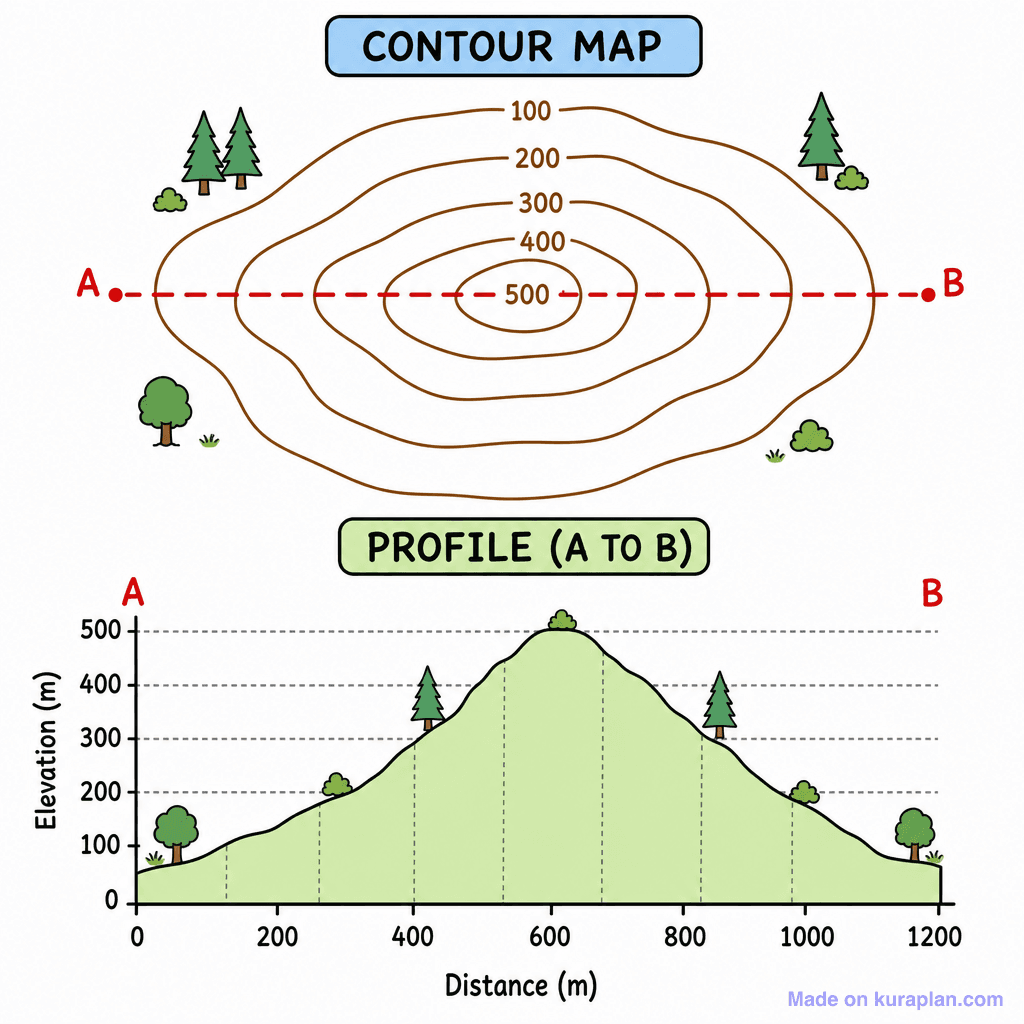
This educational image depicts a clear two-part illustration explaining geographic elevation. The top section is a contour map, rendered with concentric brown lines labeled from 100 to 500, indicating increasing elevation, surrounding a central peak. A dashed red line, labeled A to B, cuts horizontally across the map. The bottom section presents a corresponding topographic profile graph, showing elevation (m) on the y-axis and distance (m) on the x-axis, visually representing the terrain along the A-B line from the contour map. Small trees and bushes are illustrated on both the map and the profile to add visual context to the landscape. This image is ideal for slides or worksheets teaching students about contour maps, topographic profiles, and how to interpret geographical landforms, suitable for K-12 geography or earth science classes. The visual style is a clean, flat illustration with distinct labels.
How to use
- 1Right-click the image and choose “Save image as”, or use the download button.
- 2Use it in your classroom worksheets, slides or printables — free under CC BY-NC 4.0.
- 3Attribute as “Image by Kuraplan” or link back to kuraplan.com. Not for commercial resale.
Make worksheets with images like this
Kuraplan's editor has the full image library built in — drag-and-drop into a worksheet in seconds.
Related illustrations
More from Map Tools & Conventions
Browse by subject
18 subjects · 5,159 free illustrations
Maths
1,912 free illustrations
Cross-Curricular
839 free illustrations

Science
818 free illustrations
English
625 free illustrations

Health
201 free illustrations
social_studies
178 free illustrations
Religious Education
140 free illustrations
Music
130 free illustrations
Art
66 free illustrations

Drama
56 free illustrations
social_sciences
48 free illustrations
History
47 free illustrations
arts
26 free illustrations
pe
25 free illustrations
te_reo_maori
24 free illustrations

tech
16 free illustrations
culture
7 free illustrations
languages
1 free illustrations