Grid References 6 Figure Diagram — free printable diagram
Free geography resource for teachers · CC BY-NC 4.0
About this illustration
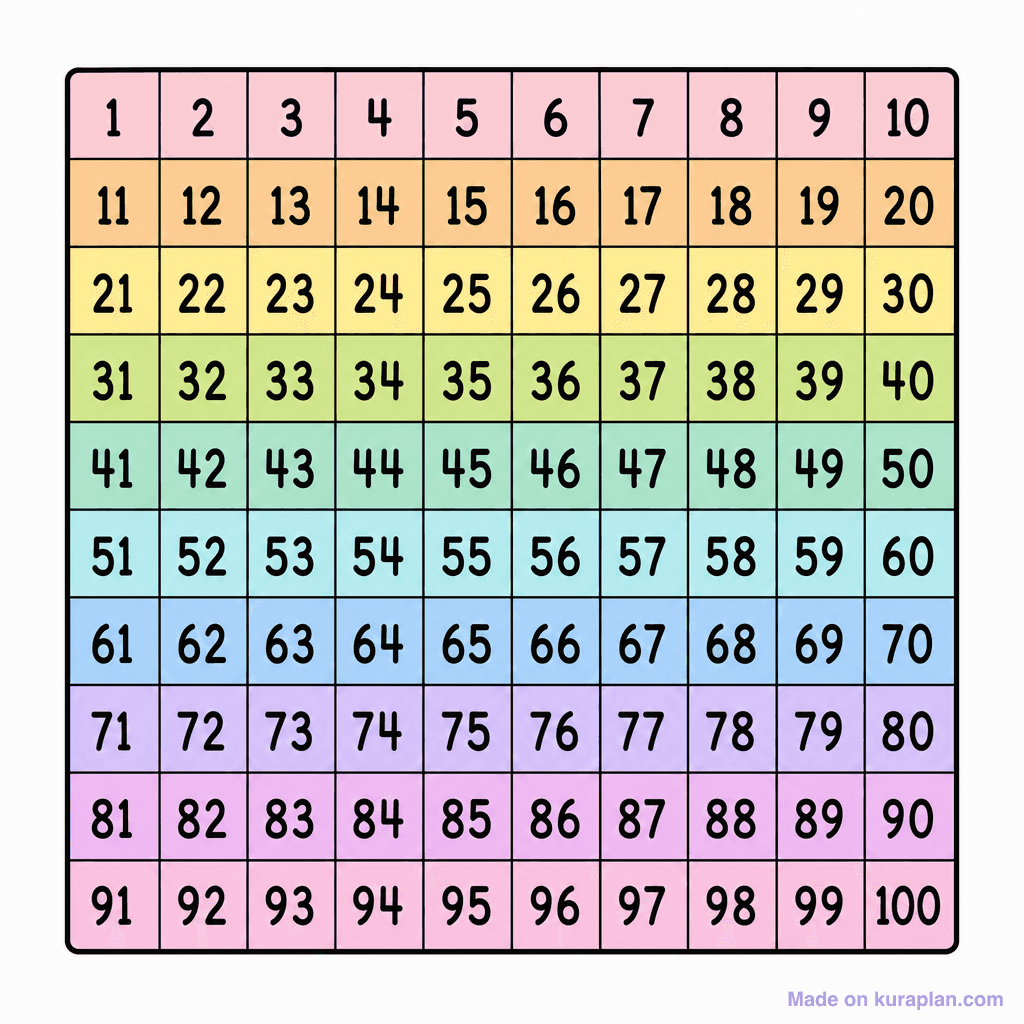
The image displays a complete 10x10 grid, commonly known as a hundred chart, with numbers from 1 to 100 arranged sequentially, with ten numbers per row. Each row features a distinct, soft pastel background color, creating a rainbow gradient from pink at the top to light purple at the bottom. The numbers are presented in clear black font within each square, which is outlined in black. This visual aid is fundamental for teaching early elementary mathematics concepts such as number recognition, counting, sequencing, skip counting, and identifying number patterns up to 100. It is a universal mathematical tool widely used in K-12 education globally. It is suitable for various classroom activities, including worksheets, interactive slide presentations, or as a reference chart for pattern identification. The visual style is a clear, colorful, and highly organized flat illustration diagram.
How to use
- 1Right-click the image and choose “Save image as”, or use the download button.
- 2Use it in your classroom worksheets, slides or printables — free under CC BY-NC 4.0.
- 3Attribute as “Image by Kuraplan” or link back to kuraplan.com. Not for commercial resale.
Make worksheets with images like this
Kuraplan's editor has the full image library built in — drag-and-drop into a worksheet in seconds.
Related illustrations
More from Map Tools & Conventions
Browse by subject
18 subjects · 5,127 free illustrations
Maths
1,900 free illustrations
Cross-Curricular
835 free illustrations
Science
816 free illustrations
English
615 free illustrations
Health
200 free illustrations
social_studies
177 free illustrations
Religious Education
139 free illustrations
Music
129 free illustrations
Art
66 free illustrations
Drama
56 free illustrations
social_sciences
48 free illustrations
History
47 free illustrations
arts
26 free illustrations
pe
25 free illustrations
te_reo_maori
24 free illustrations
tech
16 free illustrations
culture
7 free illustrations
languages
1 free illustrations