
Probability: Predicting vs. Reality
Grade 7 Mathematics Exploring Theoretical vs. Experimental Probability
Think-Pair-Share: What is Probability?
What is probability? Can probability be predicted? How do we know if our predictions are correct?
Understanding Probability Basics
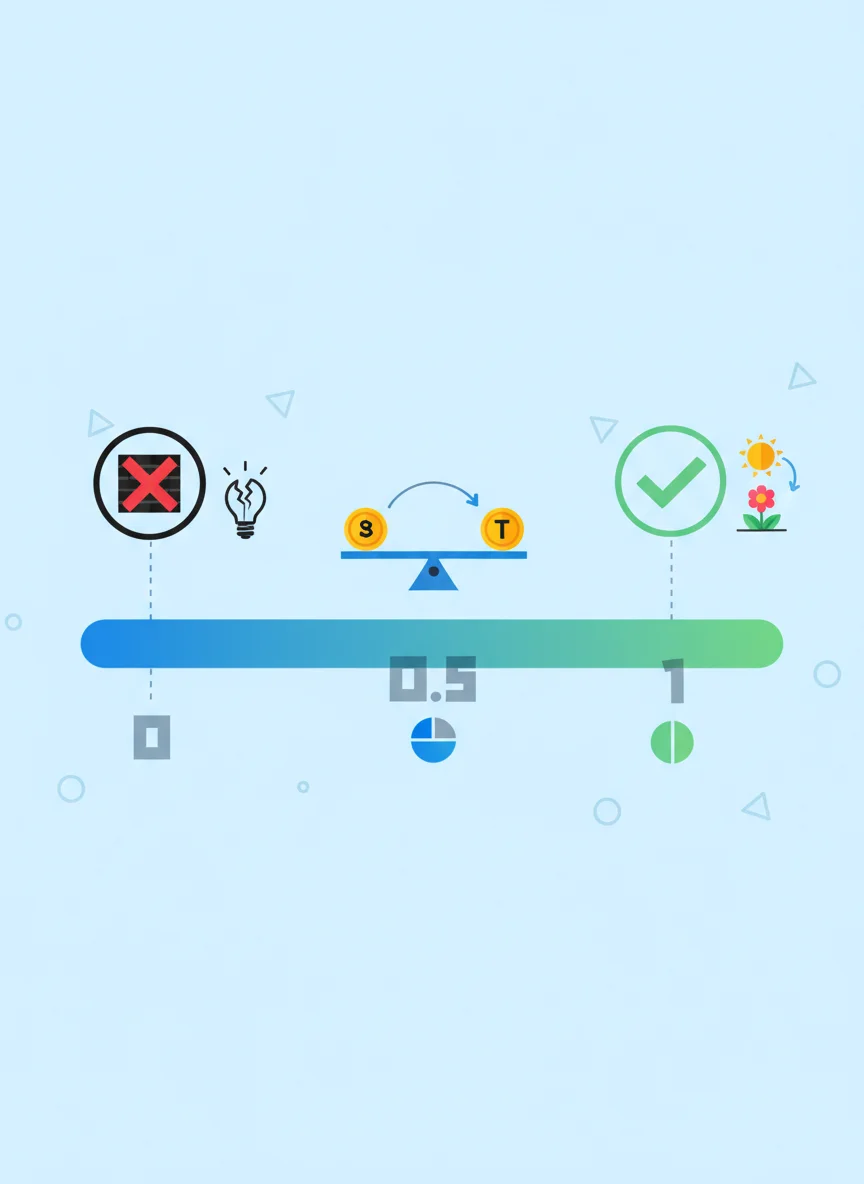
Probability tells us how likely an event is to happen Ranges from 0 (impossible) to 1 (certain) Can be expressed as fractions, decimals, or percentages Example: Flipping a fair coin has 1/2 probability of heads

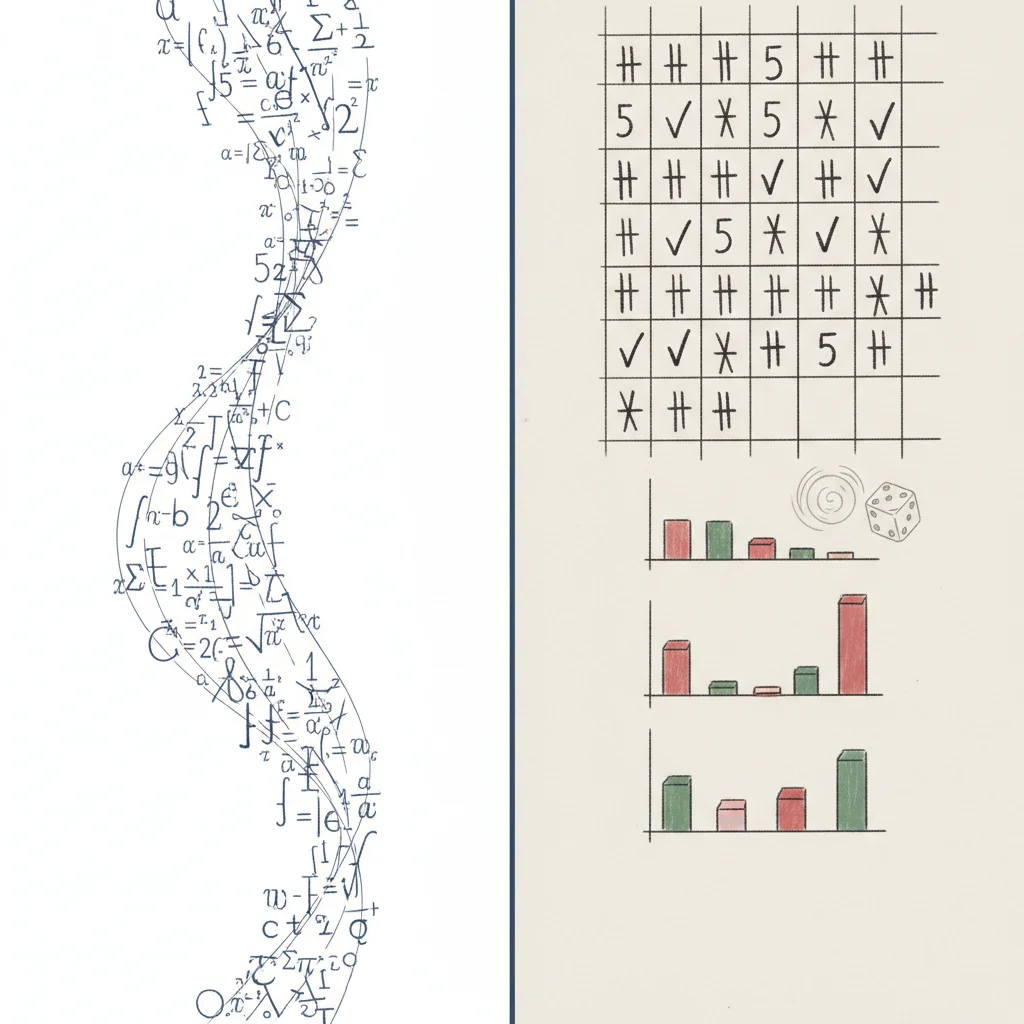
Simulation Station: Simple Events
Work in pairs with coins and dice Flip a coin 20 times - record heads/tails Roll a die 20 times - record each number Calculate experimental probability for each outcome Compare your results with theoretical probability
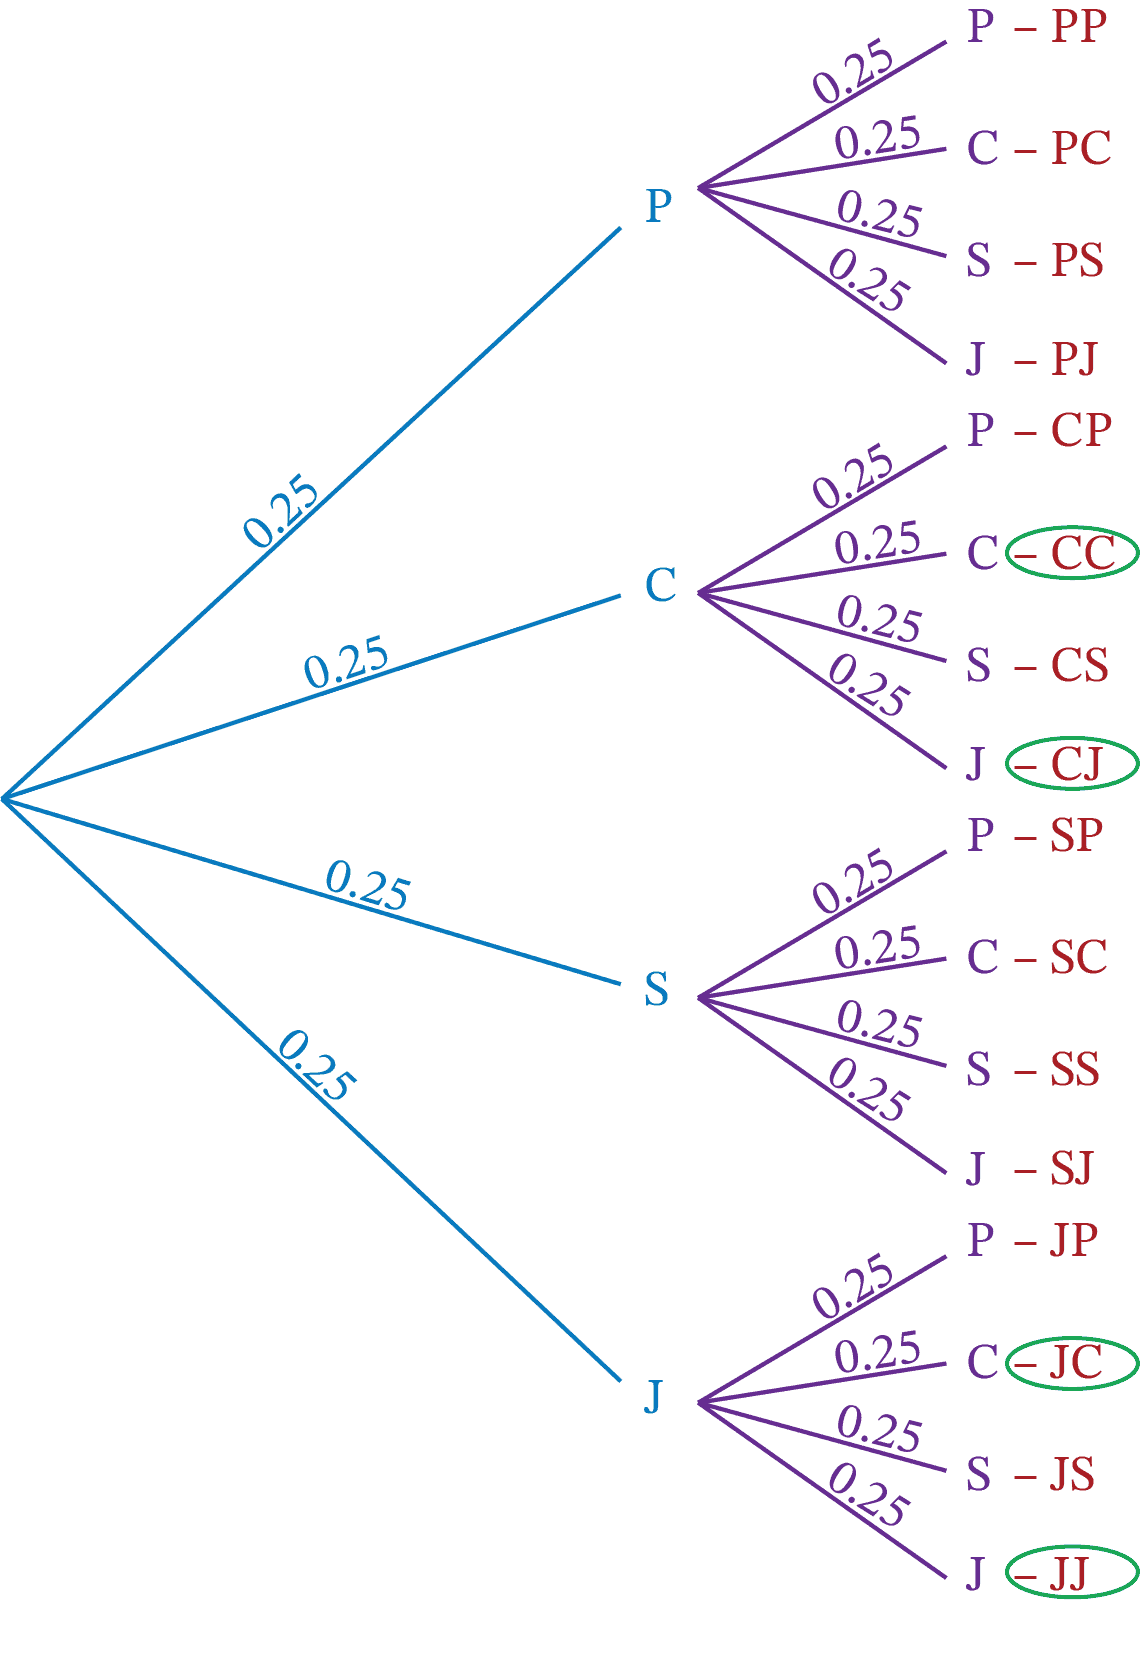
Sample Spaces and Tree Diagrams
Sample space: all possible outcomes of an event Tree diagrams help organize compound events Each branch represents one possible outcome Multiply probabilities along each path
Theoretical vs. Experimental Probability
{"left":"Theoretical Probability\nBased on mathematical reasoning\nUses known information about events\nExample: 1/6 chance of rolling a 4","right":"Experimental Probability\nBased on actual trials and observations\nUses collected data from experiments\nMay differ from theoretical due to chance"}
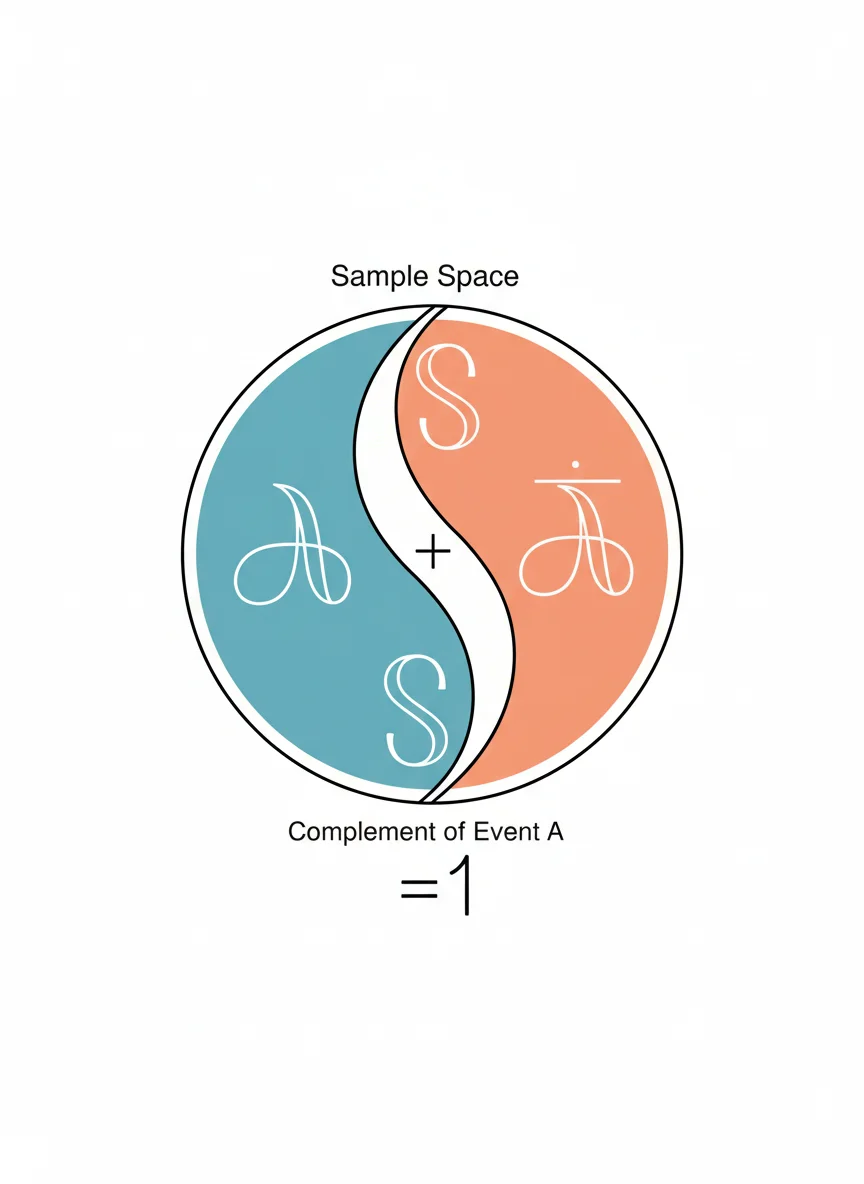
Probability and Complements
An event and its complement always add to 1 Complement: all outcomes that are NOT the event Example: P(rolling a 4) + P(not rolling a 4) = 1 If P(heads) = 1/2, then P(tails) = 1/2 Useful for checking our probability calculations
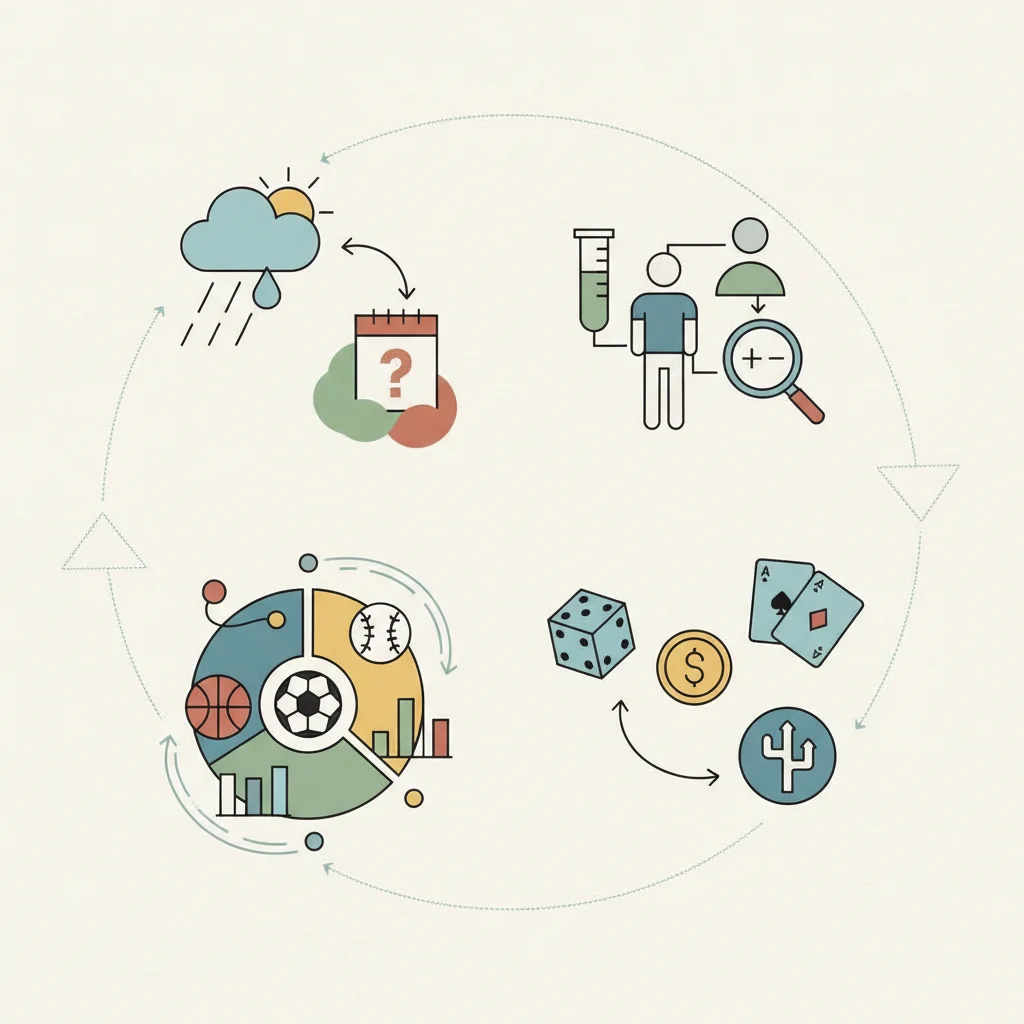
Reflection: Real-World Applications
How can simulations and tree diagrams help us make better predictions in real life? Where do you see probability in everyday situations? Why is it important to test our predictions?