Picture Graph Data Detectives
Exploring Data with Picture Graphs Grade 2 Mathematics

What Are Picture Graphs?
Picture graphs use symbols or pictures to show information Each picture represents data we collect They help us see patterns and compare information We can arrange them vertically or horizontally
Understanding the Key
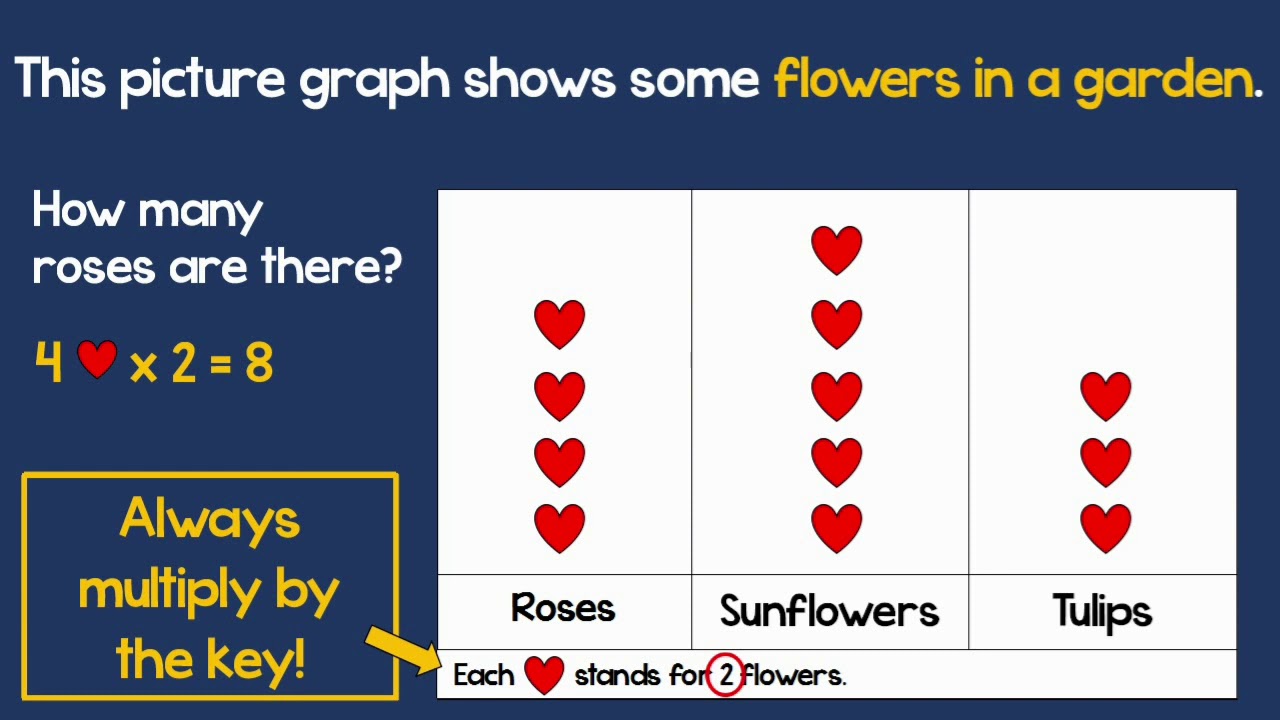
The key tells us what each picture means Sometimes 1 picture = 1 item Sometimes 1 picture = 2, 5, or even 10 items! Always check the key before reading the graph
Detective Challenge: Read This Graph!
Look at the pet graph Use the key: 1 picture = 2 kids How many kids like cats? How many kids like dogs?

Vertical vs. Horizontal Graphs
{"left":"Vertical graphs go up and down\nPictures are stacked in columns\nEasy to compare heights","right":"Horizontal graphs go left to right\nPictures are lined up in rows\nEasy to compare lengths"}

Create Your Own Graph!
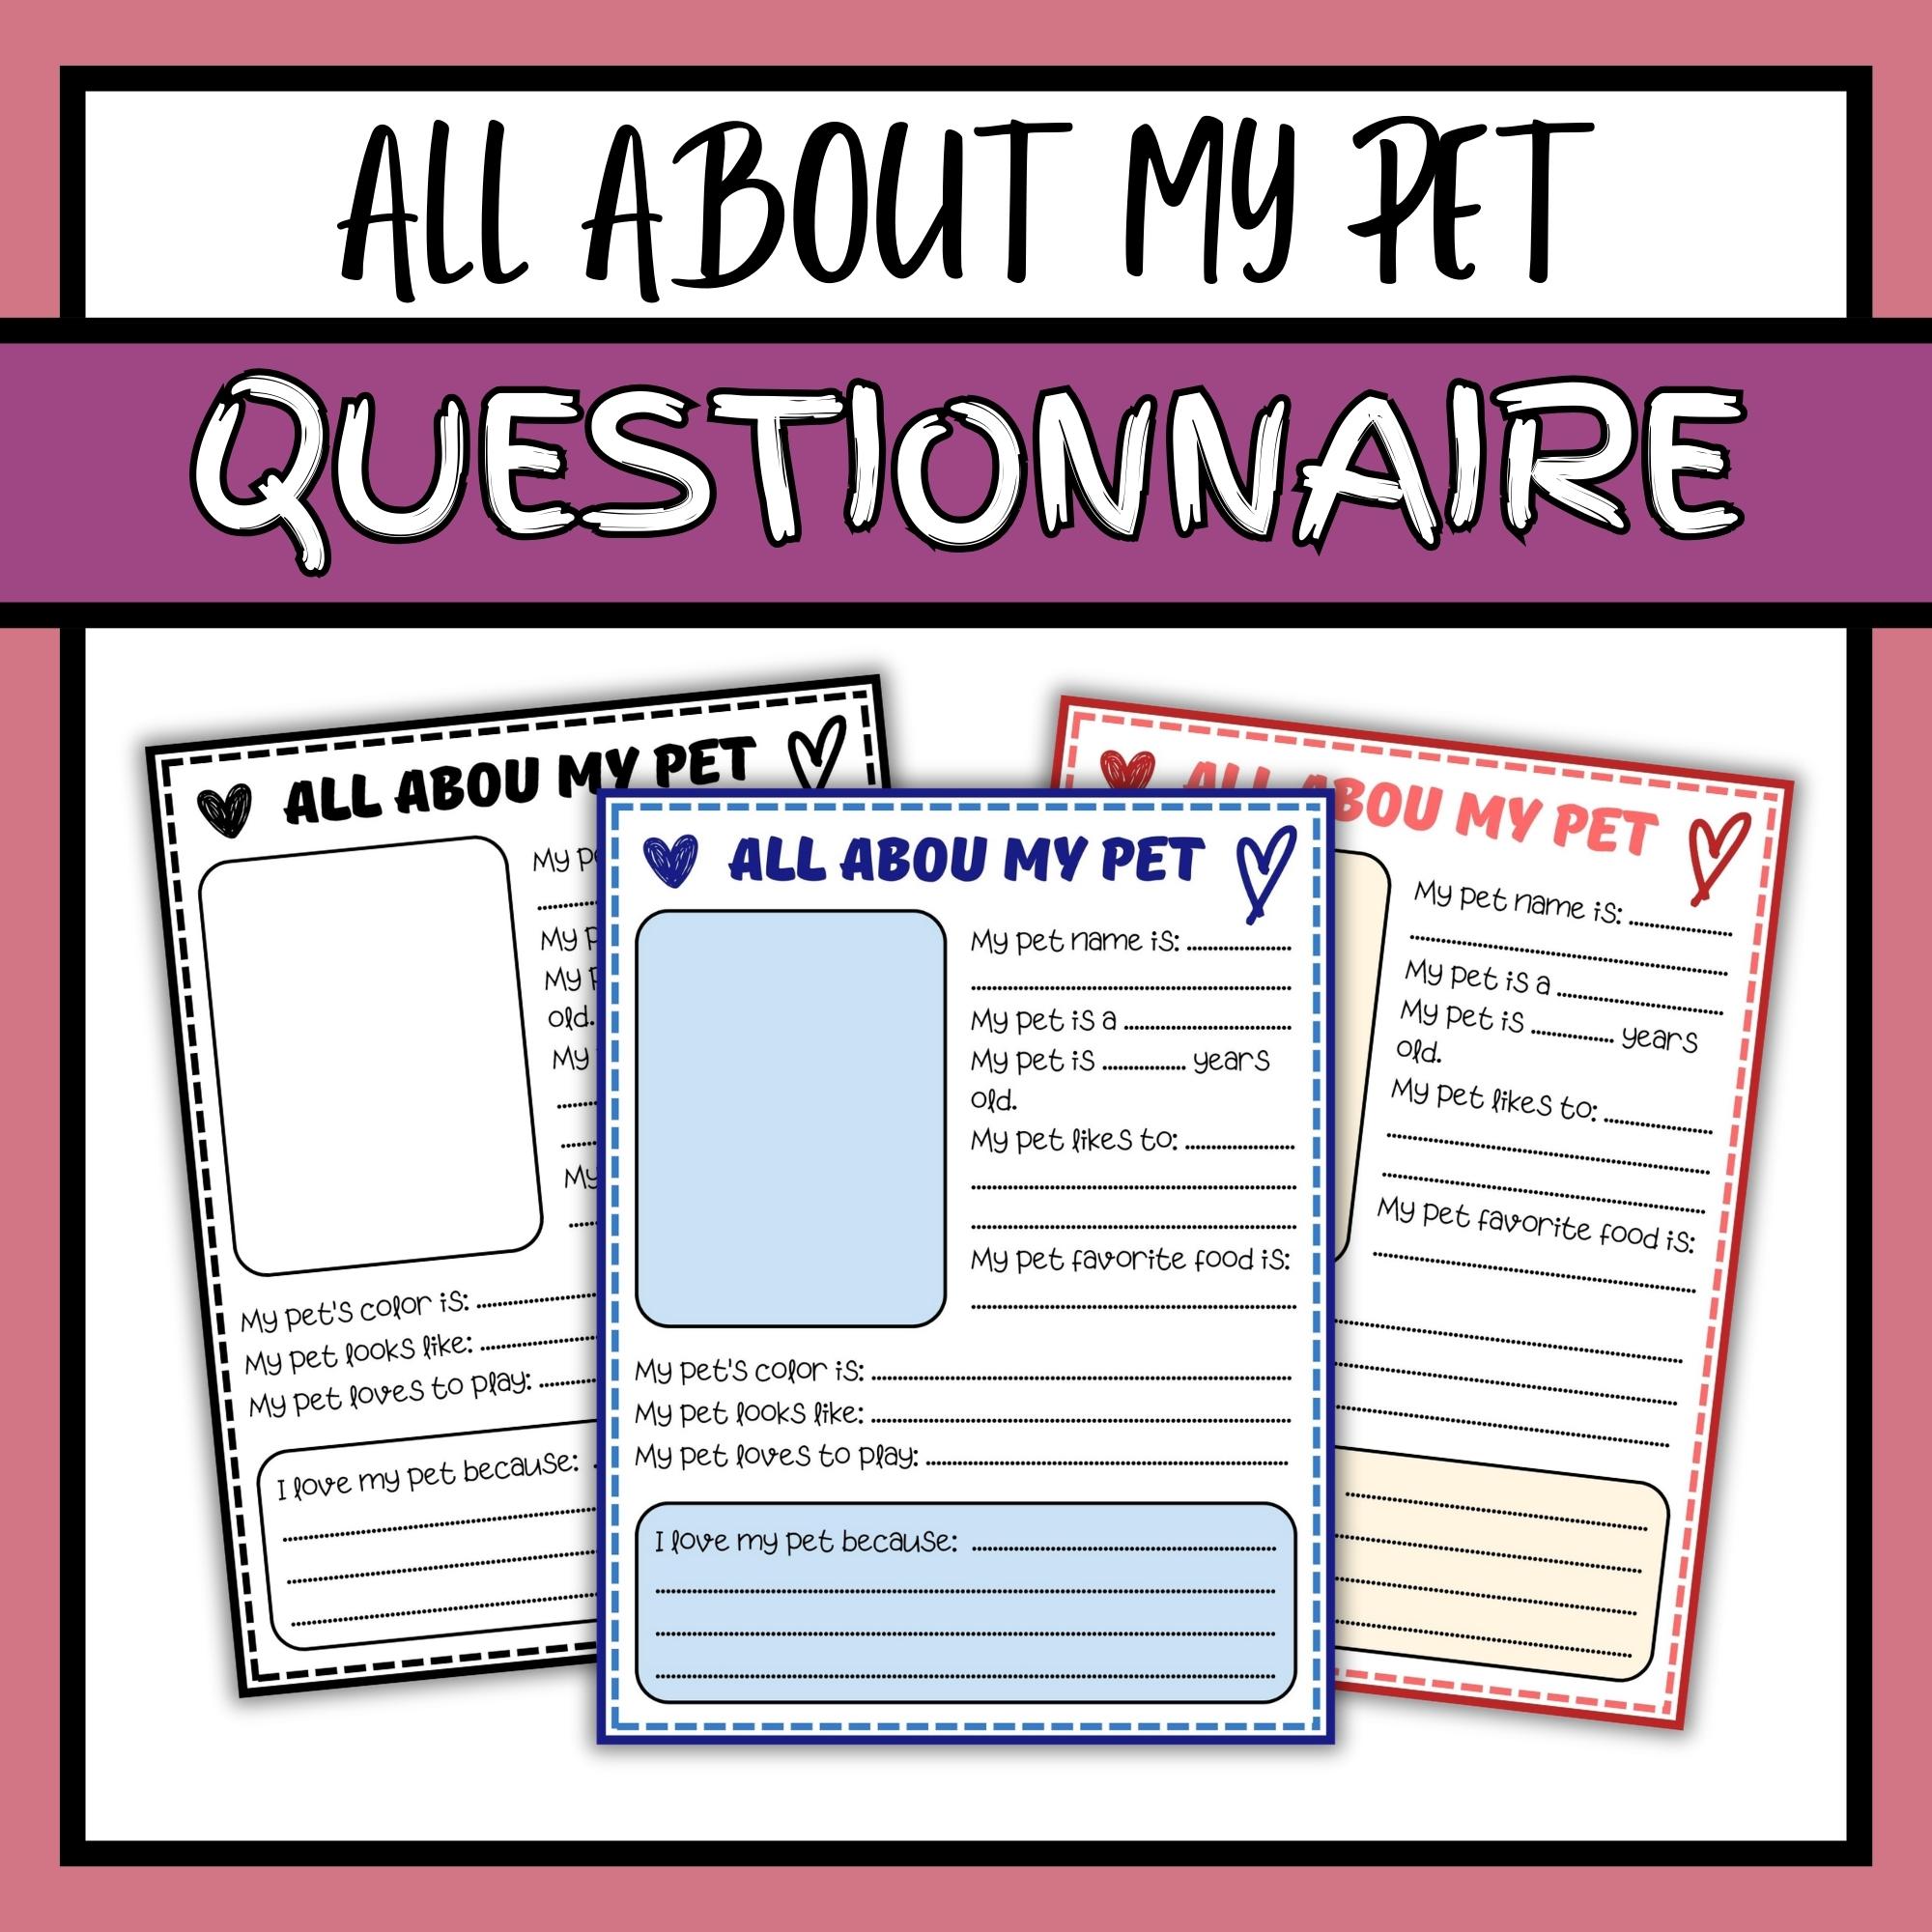
Work in groups of 5 students Choose your data topic (pets, fruits, colors, etc.) Pick a key scale (1, 2, 5, or 10) Create a picture graph with stickers Make sure to include your key!

Think About It!
When might you use a key where 1 picture = 10? What if you surveyed 100 people about their favorite ice cream? Would you want to draw 100 pictures?

Data Detectives Summary
Picture graphs show data using symbols or pictures Keys tell us what each picture represents We can make vertical or horizontal graphs Always check the key before reading! Now you're official Data Detectives!