Year 7 Statistics Practice
A free maths worksheet ready for your classroom. Open in Kuraplan to grab the print-ready PDF, customize it for your students, or generate a fresh version in seconds.
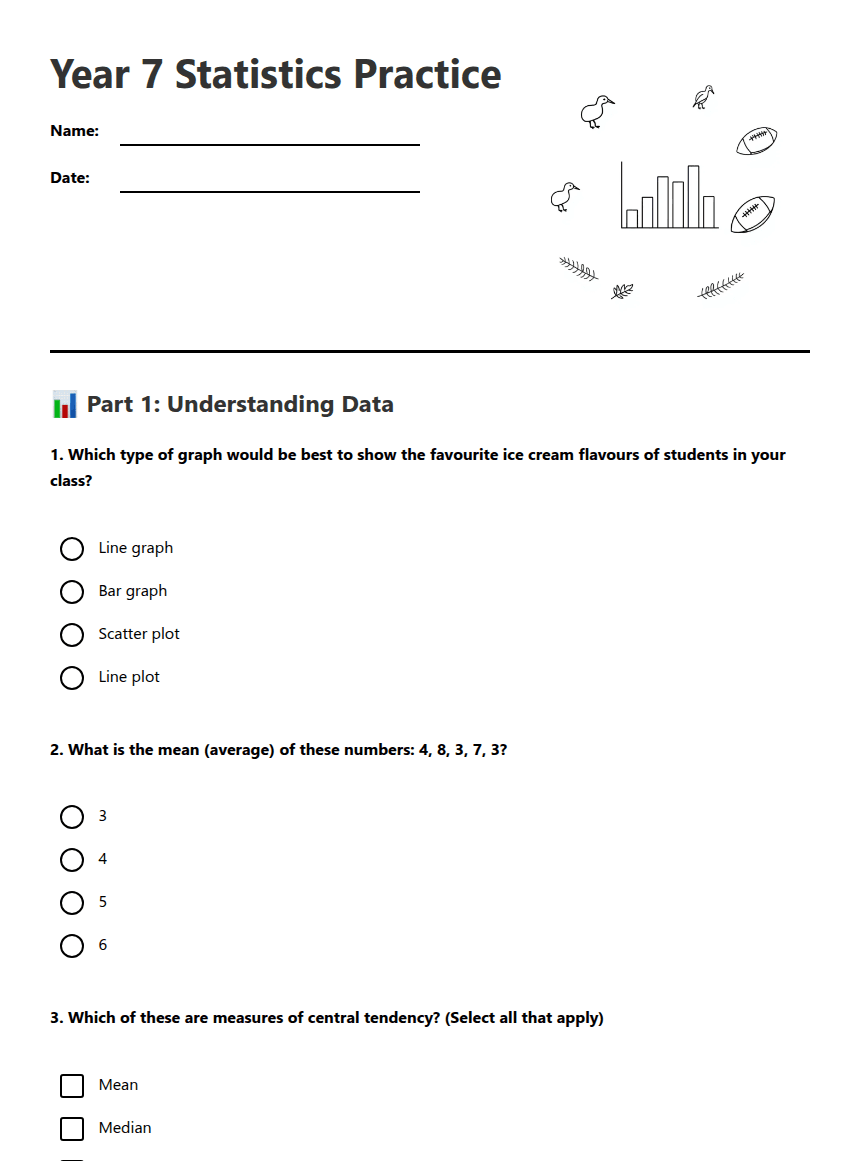
Year 7 Statistics Practice
📊 Part 1: Understanding Data
📈 Part 2: Data Analysis
Calculate:
Mean temperature: _________ °C
Median temperature: _________ °C
Range: _________ °C
What is the mode of these heights?
"The average (mean) shoe size in our class is 7, but the median is 6."
What might this tell us about the data? Explain in 1-2 sentences.
About This Worksheet
Free in Kuraplan
Sign up free, grab the PDF, and customize it for your class.
Print-Ready
Formatted for standard paper. Clean layout, easy to read.
AI-Generated
Created with Kuraplan's AI, designed for real classroom use.
For Teachers & Parents
Use in classrooms, for homework, tutoring, or homeschool.
Need a custom version of this worksheet?
Kuraplan's AI generates custom worksheets in seconds — differentiated for every learner, aligned to your curriculum.
Generate Custom Worksheets — FreeMore Maths Worksheets
Year 4 Maths Placement Test
Free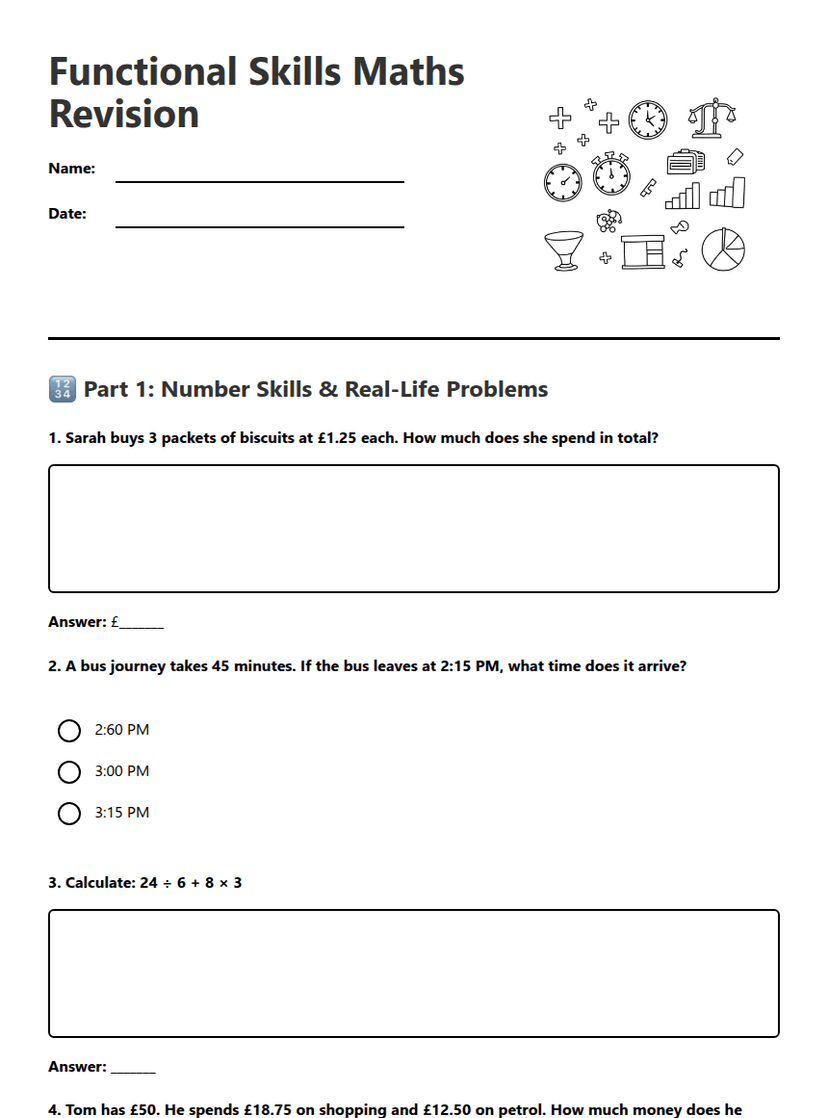
Functional Skills Maths Revision
Free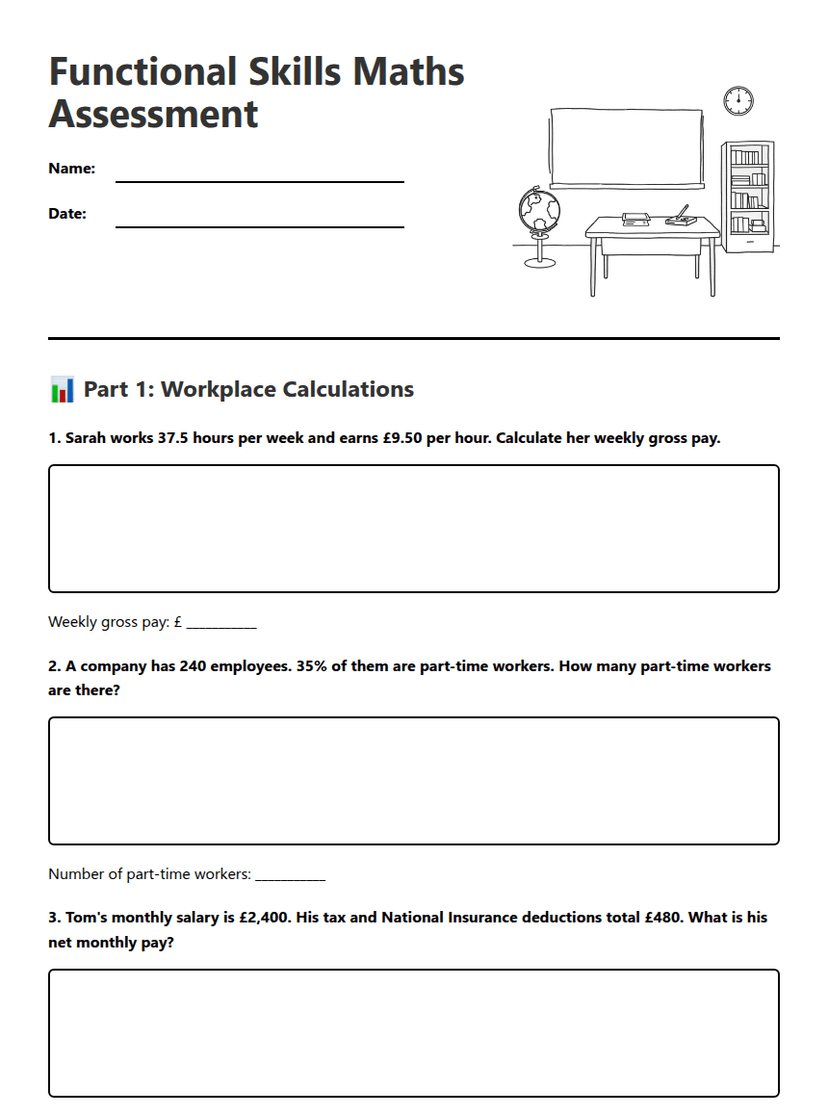
Functional Skills Maths Assessment
Free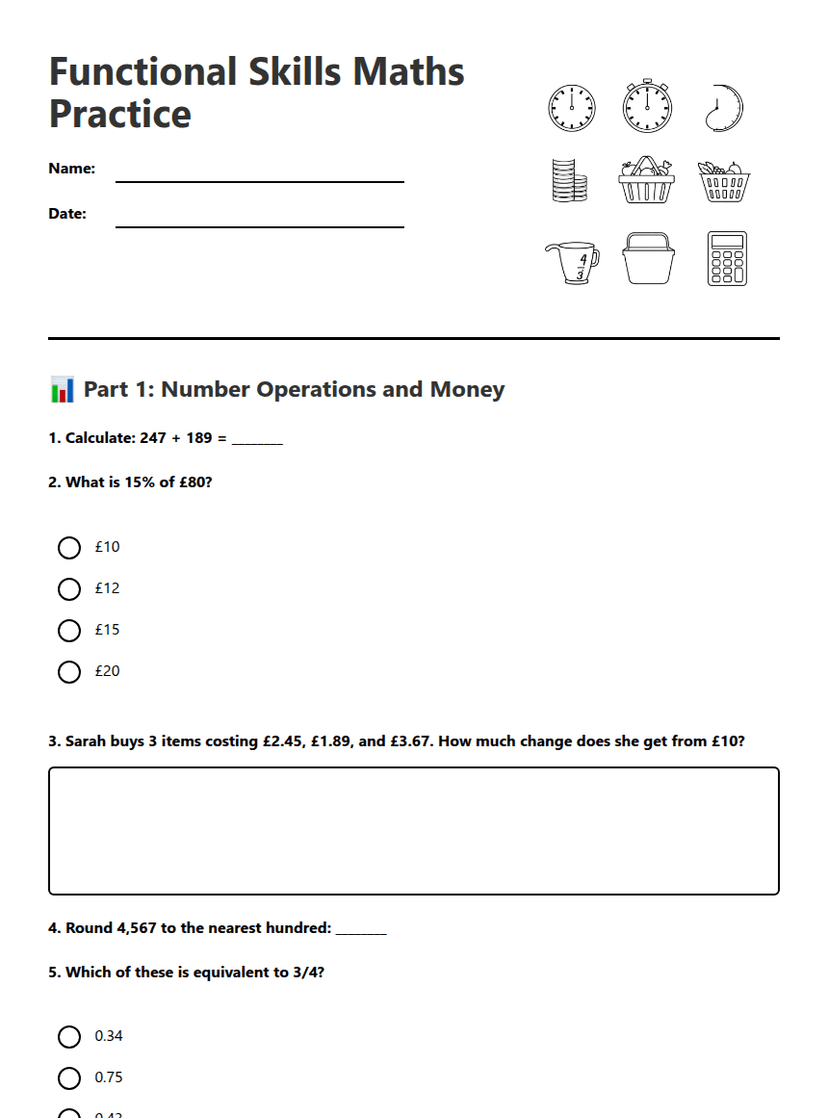
Functional Skills Maths Practice
Free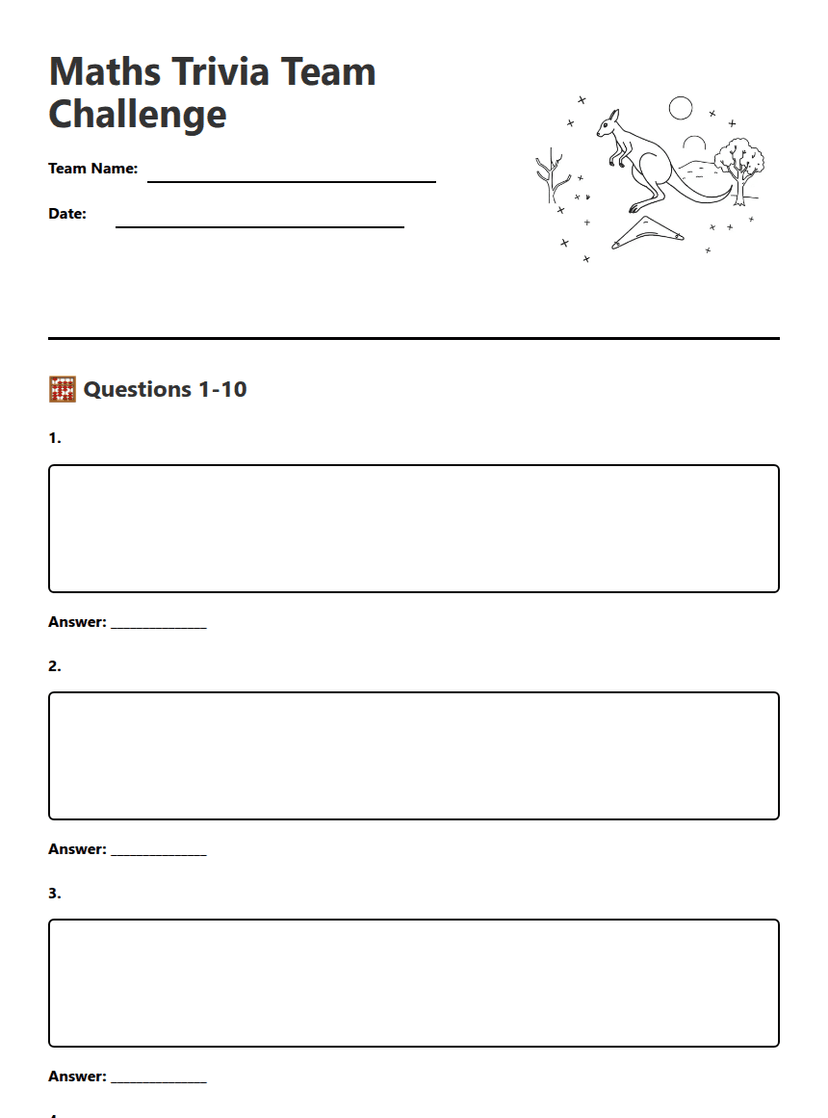
Maths Trivia Team Challenge
Free
Year 9 Maths Revision
Free
Year 10 Measurement Maths
Free