Scatter Graphs Running Times
A free maths worksheet ready for your classroom. Open in Kuraplan to grab the print-ready PDF, customize it for your students, or generate a fresh version in seconds.
Scatter Graphs Running Times
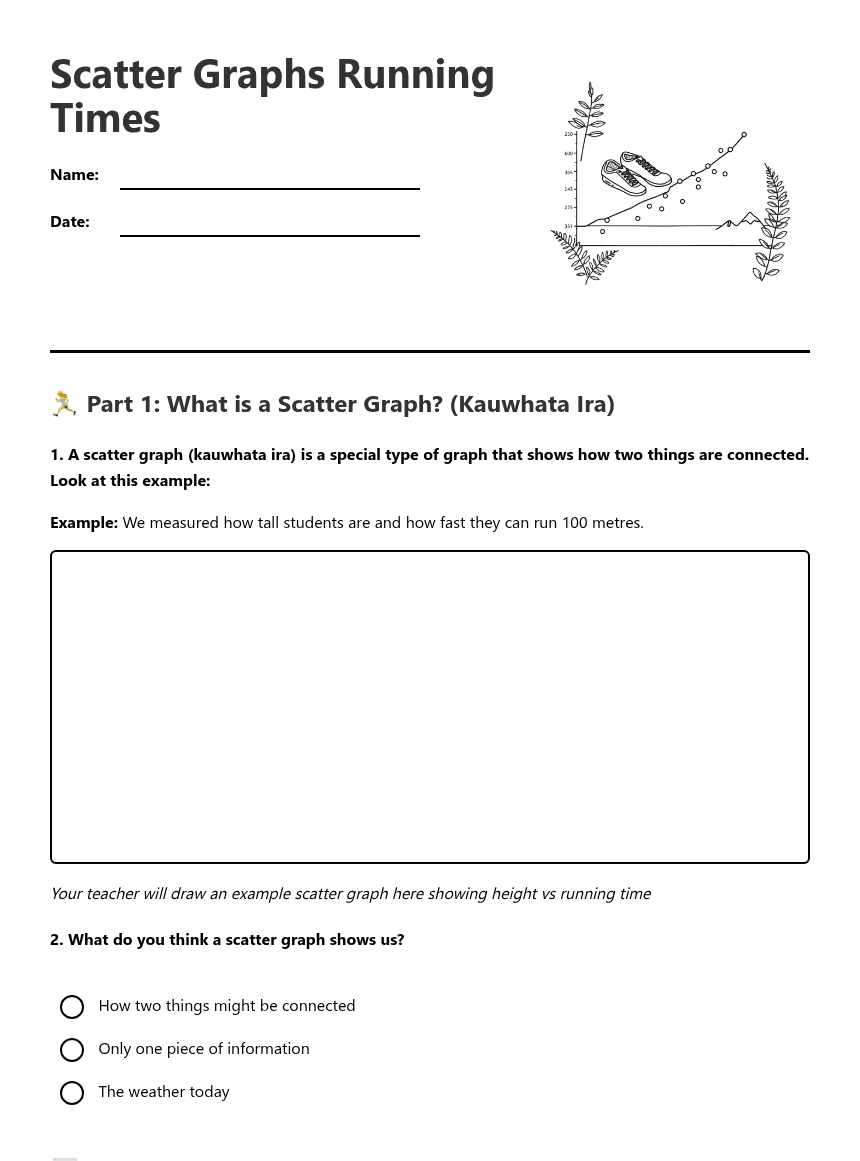
🏃♀️ Part 1: What is a Scatter Graph? (Kauwhata Ira)
Example: We measured how tall students are and how fast they can run 100 metres.
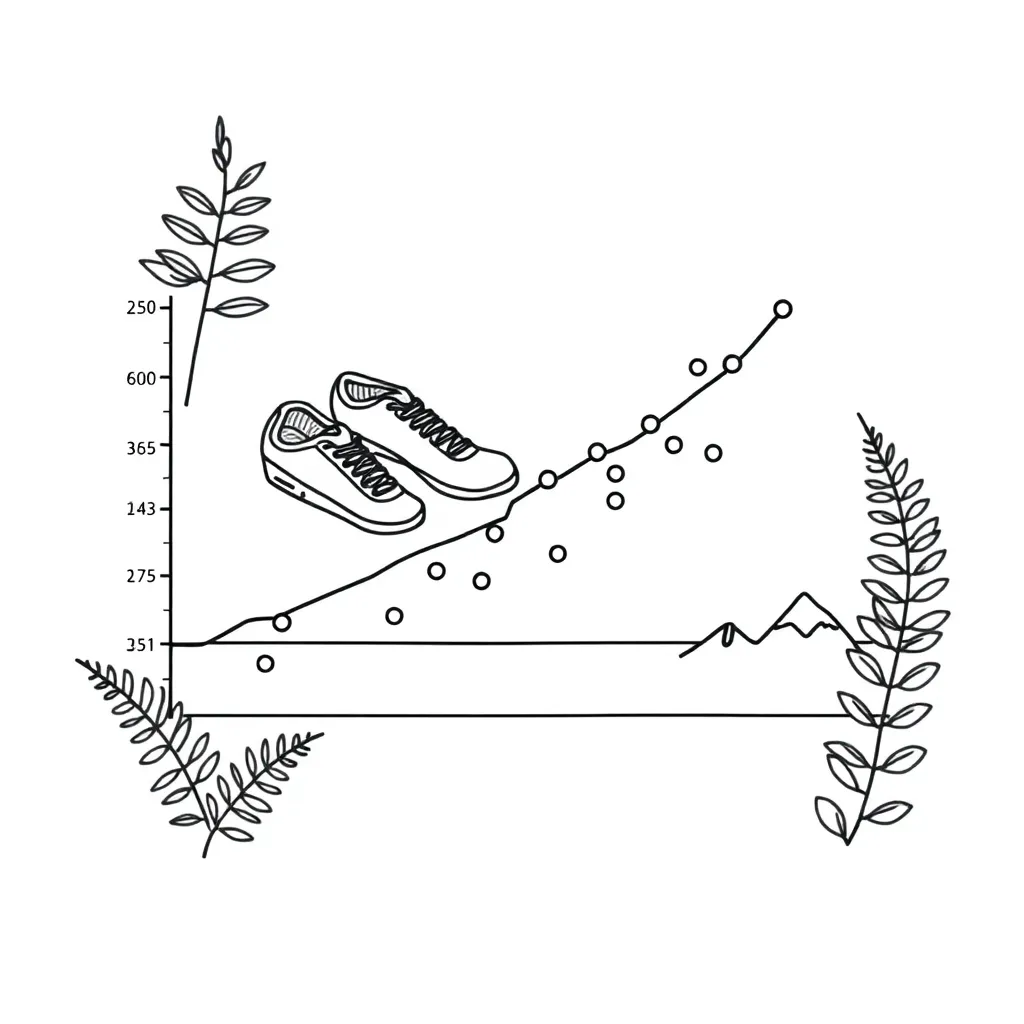
Your teacher will draw an example scatter graph here showing height vs running time
📊 Part 2: Reading Running Time Data
Student Running Times (seconds):
• Alex: 8.5 seconds
• Emma: 7.2 seconds
• Sam: 9.1 seconds
• Lily: 7.8 seconds
• Ben: 8.9 seconds
• Maya: 7.5 seconds
🎯 Part 3: Creating Your Own Scatter Graph
Data to plot:
• Student A: Age 8, Time 9.2 seconds
• Student B: Age 9, Time 8.1 seconds
• Student C: Age 10, Time 7.8 seconds
• Student D: Age 8, Time 9.5 seconds
• Student E: Age 9, Time 8.3 seconds
• Put Age along the bottom (horizontal line)
• Put Running Time up the side (vertical line)
• Mark each student with a dot
🤔 Part 4: Understanding Patterns
A scatter graph helps us see if there is a _____________ between two different measurements. In our graph, we compared _______ and _____________. The dots on the graph represent each _____________.
🏃♂️ Part 5: Your Own Investigation
What would you like to compare with running times?
Why do you think these two things might be connected?
About This Worksheet
Free in Kuraplan
Sign up free, grab the PDF, and customize it for your class.
Print-Ready
Formatted for standard paper. Clean layout, easy to read.
AI-Generated
Created with Kuraplan's AI, designed for real classroom use.
For Teachers & Parents
Use in classrooms, for homework, tutoring, or homeschool.
Need a custom version of this worksheet?
Kuraplan's AI generates custom worksheets in seconds — differentiated for every learner, aligned to your curriculum.
Generate Custom Worksheets — FreeMore Maths Worksheets
Year 4 Maths Placement Test
Free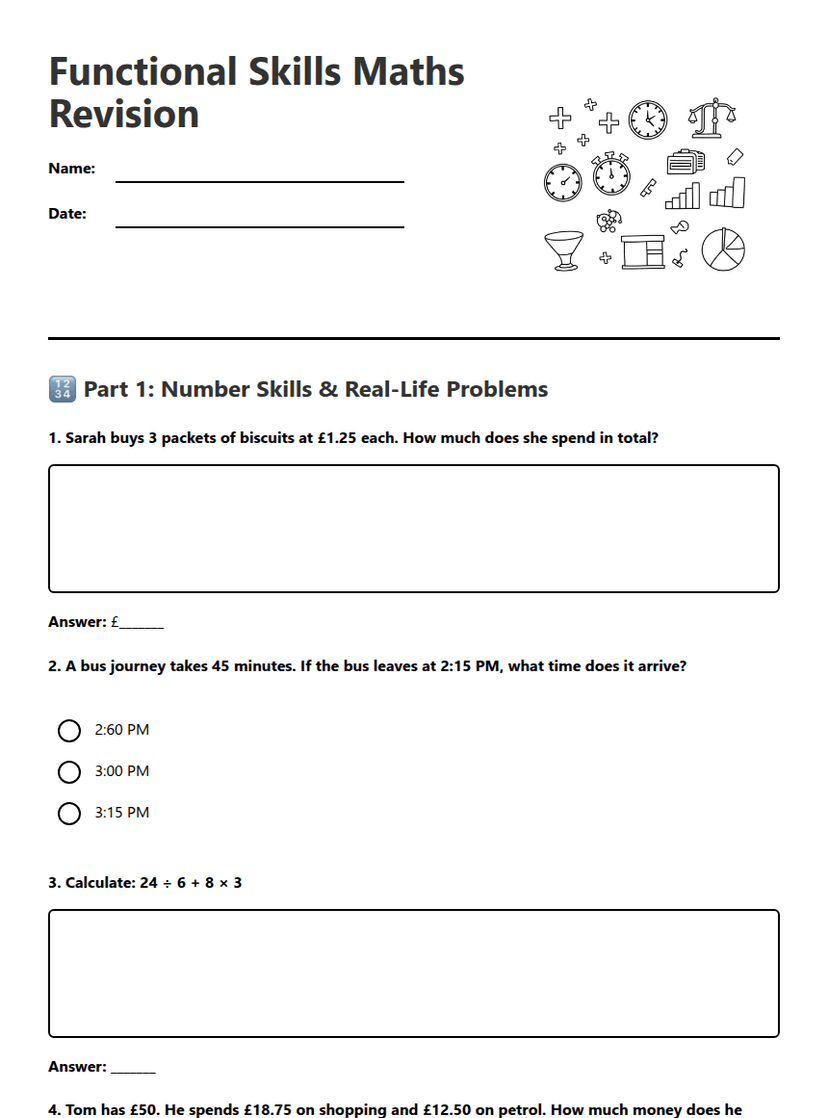
Functional Skills Maths Revision
Free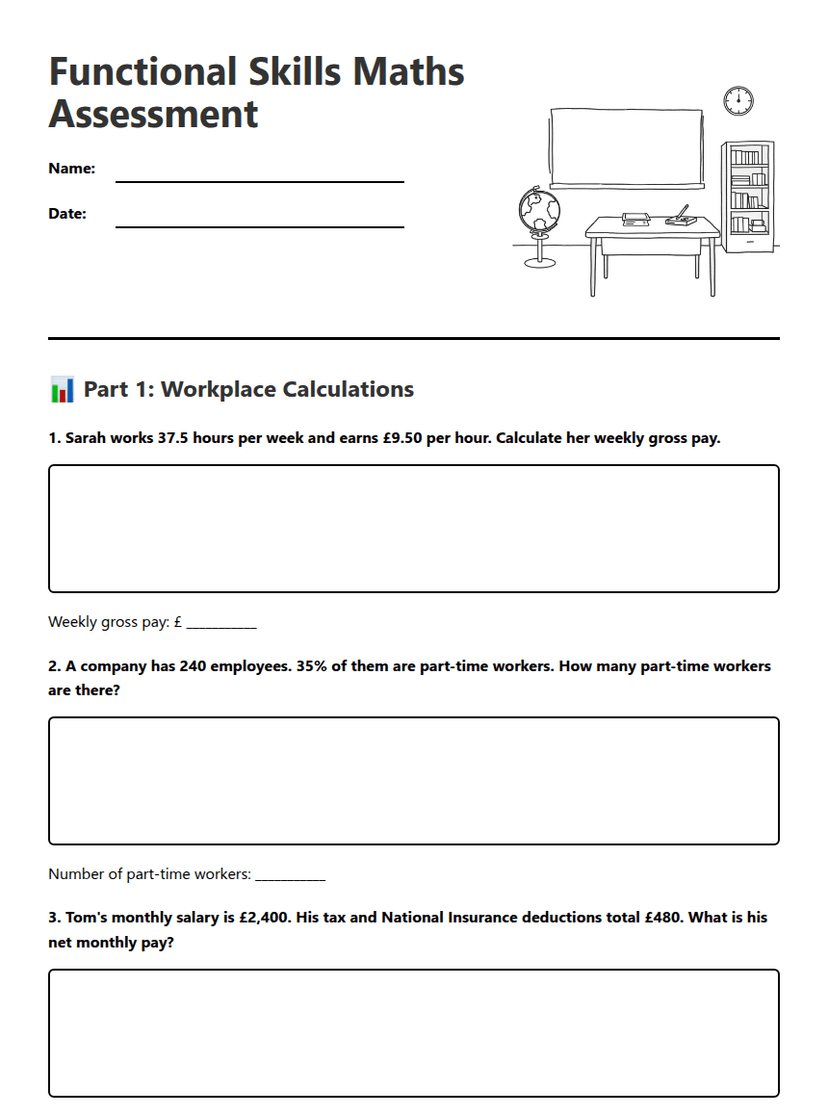
Functional Skills Maths Assessment
Free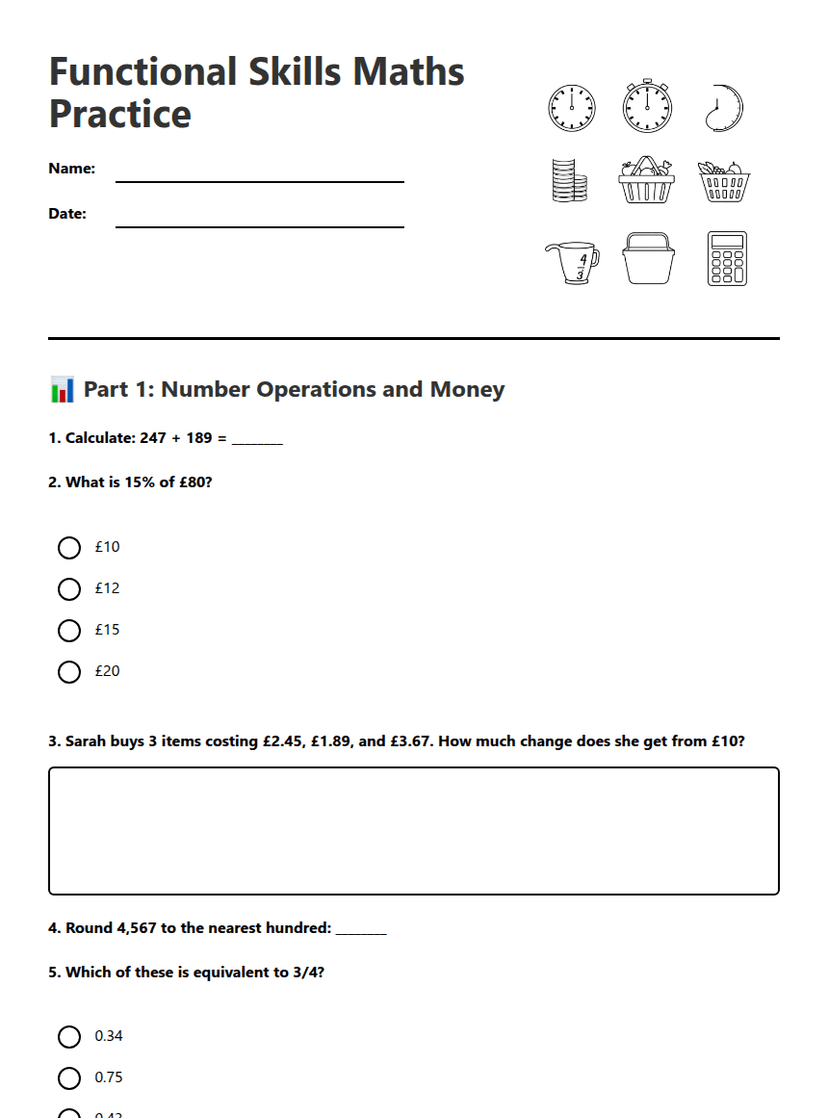
Functional Skills Maths Practice
Free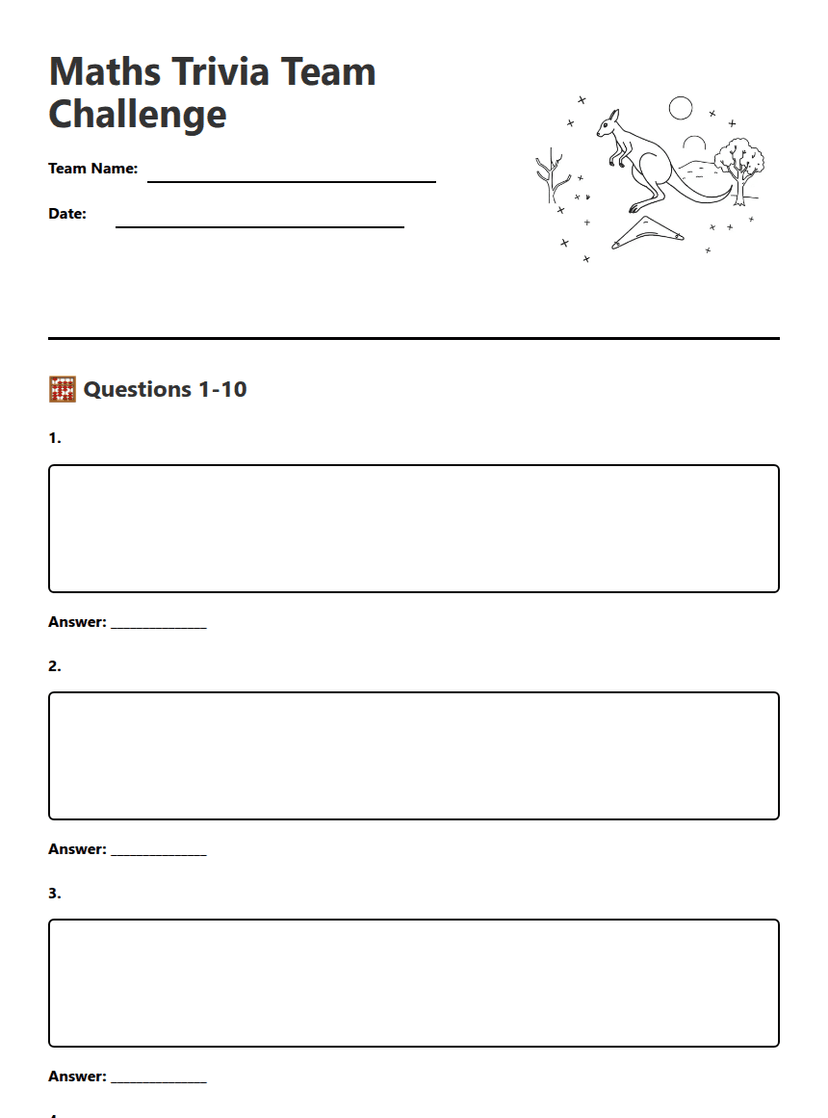
Maths Trivia Team Challenge
Free
Year 9 Maths Revision
Free
Year 10 Measurement Maths
Free