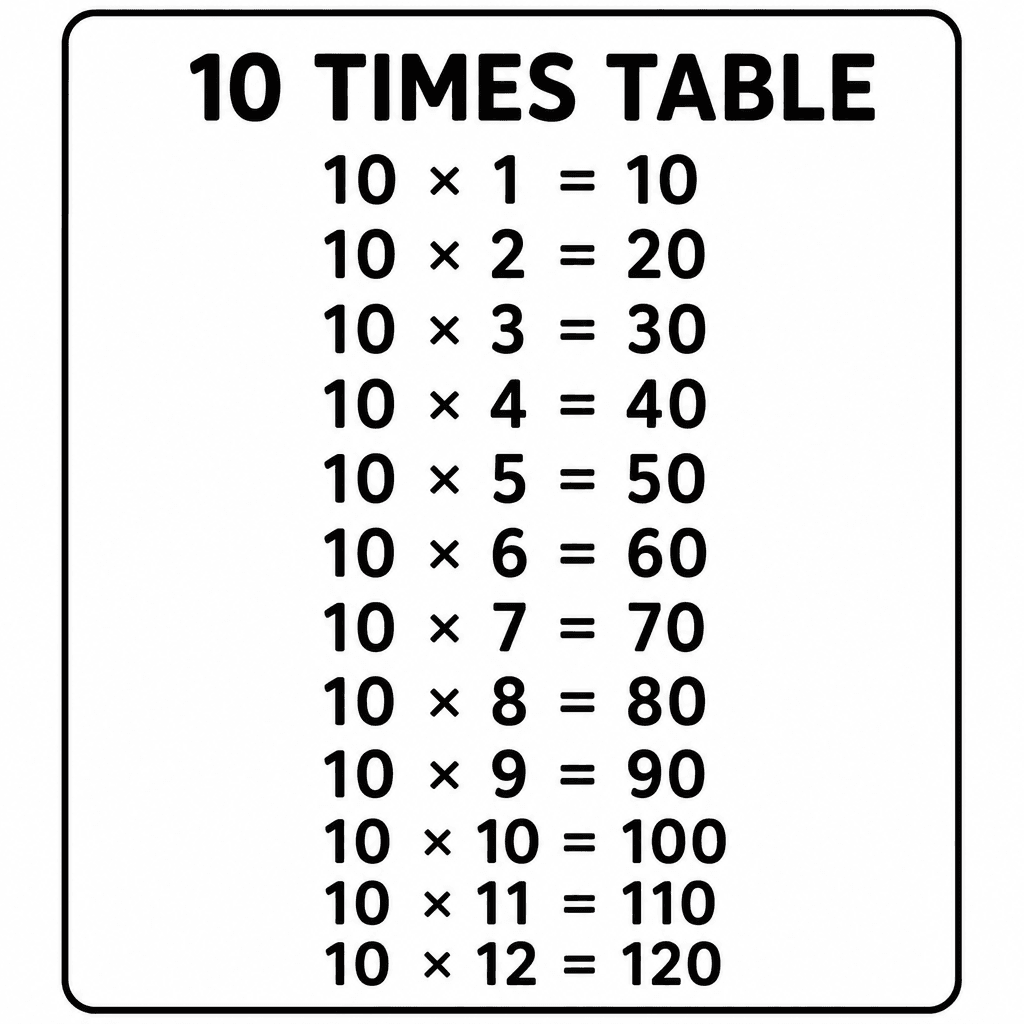
10 Times Table Chart — free printable diagram
Free maths resource for teachers · CC BY-NC 4.0
About this illustration
A clear, high-contrast black and white graphic displaying the 10 times table from 10 x 1 = 10 up to 10 x 12 = 120, centered on a white background within a thick black rectangular border. This image teaches fundamental multiplication facts and supports the development of numeracy skills. It is suitable for universal use, with no specific cultural or locale cues. Teachers can utilize this graphic for creating worksheets, presentation slides, flashcards, or classroom display posters for memorization and practice activities. The visual style is a functional, flat illustration with clear, bold text.
How to use
- 1Right-click the image and choose “Save image as”, or use the download button.
- 2Use it in your classroom worksheets, slides or printables — free under CC BY-NC 4.0.
- 3Attribute as “Image by Kuraplan” or link back to kuraplan.com. Not for commercial resale.
Make worksheets with images like this
Kuraplan's editor has the full image library built in — drag-and-drop into a worksheet in seconds.
Browse by subject
15 subjects · 2,247 free illustrations

Cross-Curricular
580 free illustrations

Science
424 free illustrations

Geography
352 free illustrations
English
327 free illustrations

Religious Education
140 free illustrations
Music
108 free illustrations

Health
102 free illustrations
Drama
58 free illustrations

Art
56 free illustrations
History
43 free illustrations

social_studies
21 free illustrations
tech
16 free illustrations
pe
14 free illustrations

te_reo_maori
5 free illustrations

languages
1 free illustrations