Synoptic Chart Uk — free printable diagram
Free geography resource for teachers · CC BY-NC 4.0
About this illustration
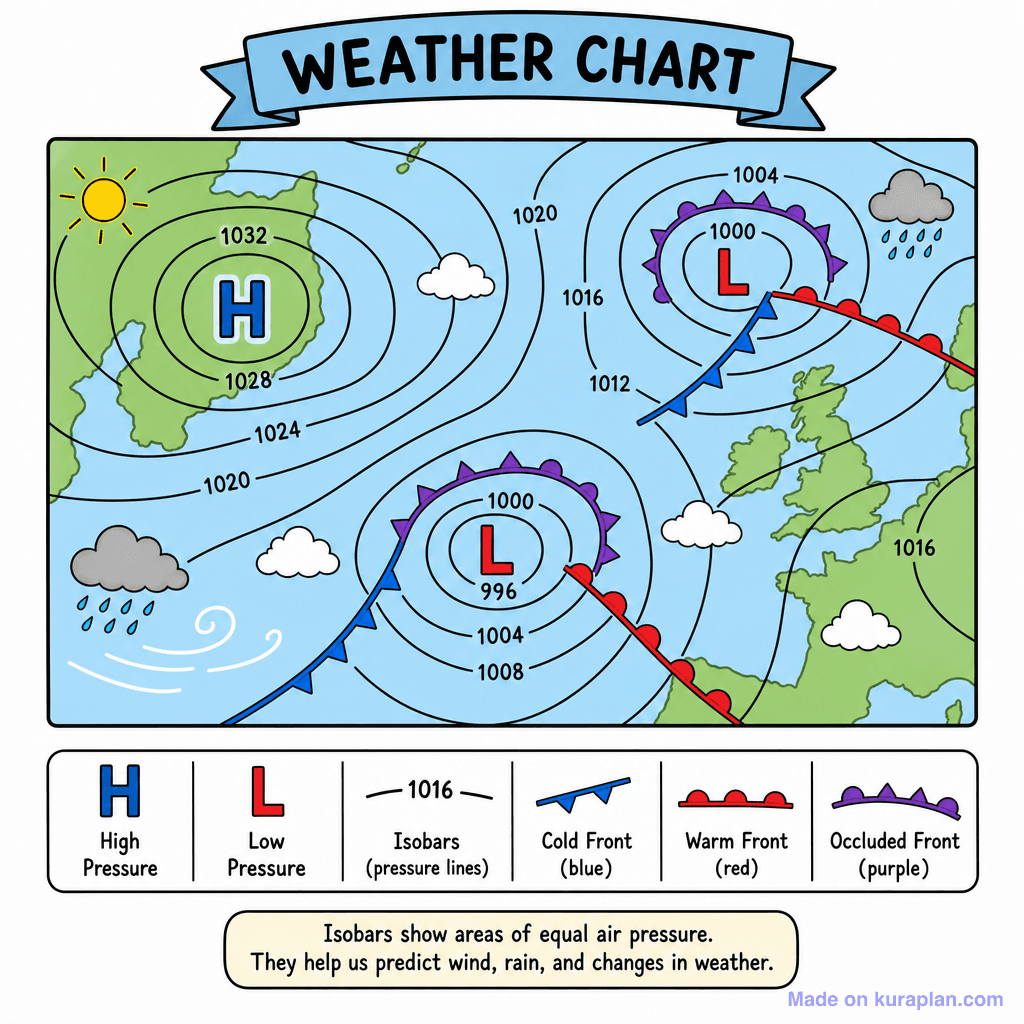
This flat illustration depicts a detailed weather chart, featuring a simplified map of Western Europe and the North Atlantic region. It clearly illustrates high (H) and low (L) pressure systems using isobar lines, alongside various weather fronts including cold (blue triangles), warm (red semicircles), and occluded (purple triangles and semicircles) fronts. The image also incorporates common weather symbols for sun, clouds, and rain, all defined in a comprehensive legend at the bottom. An explanatory text box clarifies the role of isobars in weather prediction. This resource is excellent for teaching basic meteorology concepts, weather map interpretation, and atmospheric pressure, suitable for science or geography lessons, particularly within a UK or European-focused curriculum, and can be used effectively on slides or as part of a worksheet activity.
How to use
- 1Right-click the image and choose “Save image as”, or use the download button.
- 2Use it in your classroom worksheets, slides or printables — free under CC BY-NC 4.0.
- 3Attribute as “Image by Kuraplan” or link back to kuraplan.com. Not for commercial resale.
Make worksheets with images like this
Kuraplan's editor has the full image library built in — drag-and-drop into a worksheet in seconds.
Related illustrations
More from Weather & Climate


Browse by subject
18 subjects · 5,159 free illustrations
Maths
1,912 free illustrations
Cross-Curricular
839 free illustrations

Science
818 free illustrations
English
625 free illustrations

Health
201 free illustrations
social_studies
178 free illustrations
Religious Education
140 free illustrations
Music
130 free illustrations

Art
66 free illustrations
Drama
56 free illustrations
social_sciences
48 free illustrations
History
47 free illustrations
arts
26 free illustrations

pe
25 free illustrations

te_reo_maori
24 free illustrations

tech
16 free illustrations

culture
7 free illustrations

languages
1 free illustrations