Percentage pie charts (25/50/75/100%) — free printable diagram
Free maths resource for teachers · CC BY-NC 4.0
About this illustration
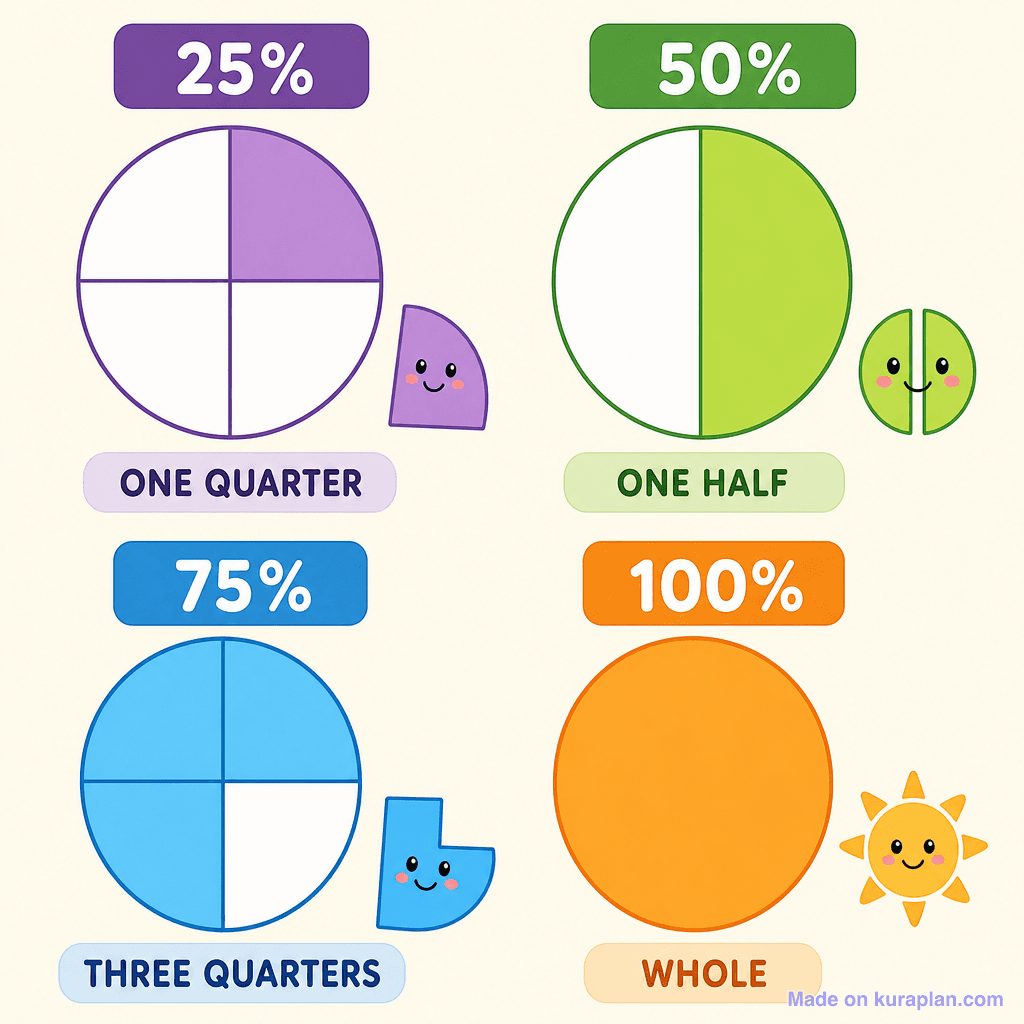
This educational graphic depicts four clear examples of fractions and their equivalent percentages using colourful segmented circles. It illustrates 25% as one purple quarter, 50% as one green half, 75% as three blue quarters, and 100% as a whole orange circle. Each section includes a cute, anthropomorphic representation of the fractional piece or a sun for the whole, aiding in the visual understanding of these fundamental mathematical concepts. This visual aid is suitable for primary school math lessons, perfect for worksheets, slide presentations, or flashcards introducing fractions and percentages.
How to use
- 1Right-click the image and choose “Save image as”, or use the download button.
- 2Use it in your classroom worksheets, slides or printables — free under CC BY-NC 4.0.
- 3Attribute as “Image by Kuraplan” or link back to kuraplan.com. Not for commercial resale.
Make worksheets with images like this
Kuraplan's editor has the full image library built in — drag-and-drop into a worksheet in seconds.
Browse by subject
15 subjects · 2,247 free illustrations

Cross-Curricular
580 free illustrations

Science
424 free illustrations

Geography
352 free illustrations
English
327 free illustrations

Religious Education
140 free illustrations
Music
108 free illustrations

Health
102 free illustrations

Drama
58 free illustrations

Art
56 free illustrations
History
43 free illustrations

social_studies
21 free illustrations
tech
16 free illustrations

pe
14 free illustrations

te_reo_maori
5 free illustrations

languages
1 free illustrations