Mean, median and mode of one dataset — free printable diagram
Free maths resource for teachers · CC BY-NC 4.0
About this illustration
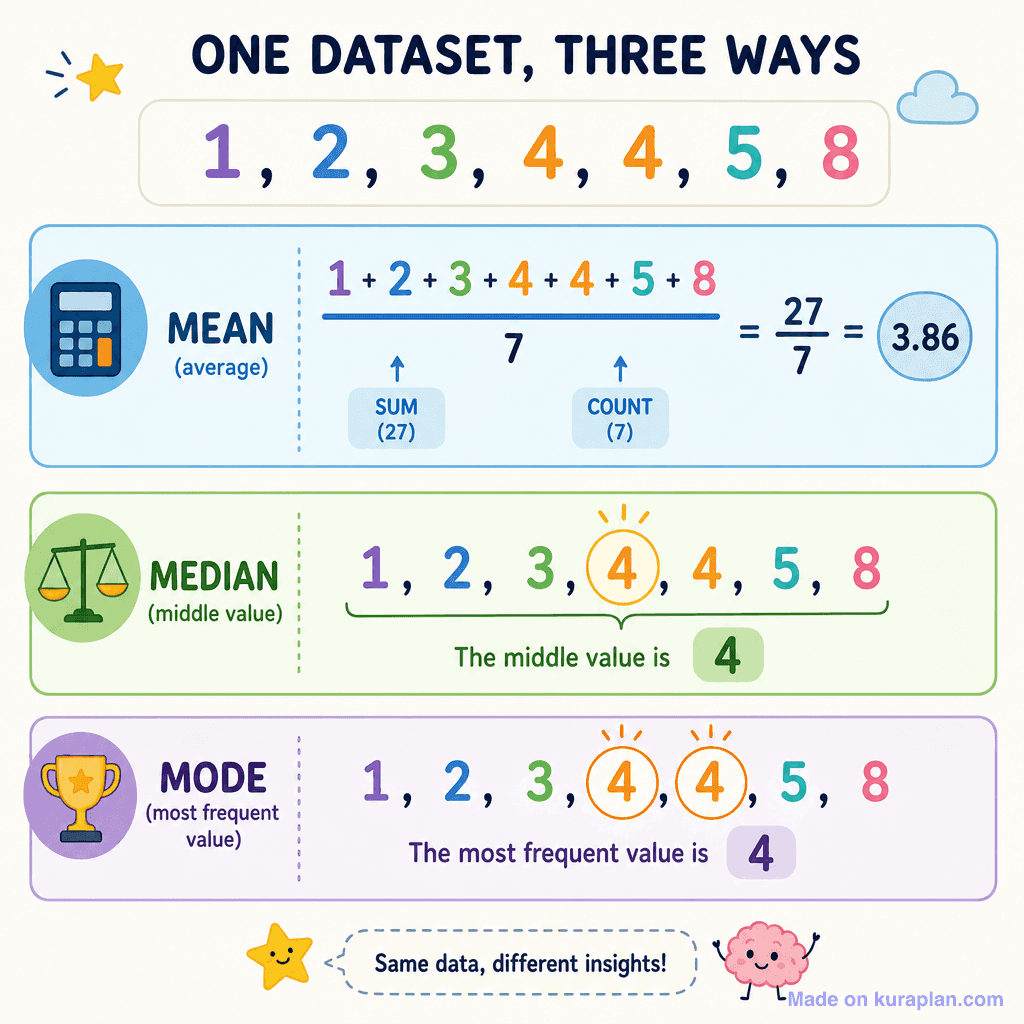
This brightly colored educational infographic explains the statistical concepts of mean, median, and mode using a single numerical dataset, suitable for elementary to middle school students. Presented in a clean, friendly visual style, it utilizes illustrative icons like a calculator, scales, and a trophy to represent each concept. The graphic is self-contained, offering a clear visual breakdown of how to calculate and identify each measure of central tendency.
How to use
- 1Right-click the image and choose “Save image as”, or use the download button.
- 2Use it in your classroom worksheets, slides or printables — free under CC BY-NC 4.0.
- 3Attribute as “Image by Kuraplan” or link back to kuraplan.com. Not for commercial resale.
Make worksheets with images like this
Kuraplan's editor has the full image library built in — drag-and-drop into a worksheet in seconds.
Browse by subject
18 subjects · 3,780 free illustrations
Cross-Curricular
835 free illustrations
Science
816 free illustrations
English
615 free illustrations
Geography
553 free illustrations
Health
200 free illustrations
social_studies
177 free illustrations
Religious Education
139 free illustrations
Music
129 free illustrations
Art
66 free illustrations
Drama
56 free illustrations
social_sciences
48 free illustrations
History
47 free illustrations
arts
26 free illustrations
pe
25 free illustrations
te_reo_maori
24 free illustrations
tech
16 free illustrations
culture
7 free illustrations
languages
1 free illustrations