Dot plot / line plot — free printable diagram
Free maths resource for teachers · CC BY-NC 4.0
About this illustration
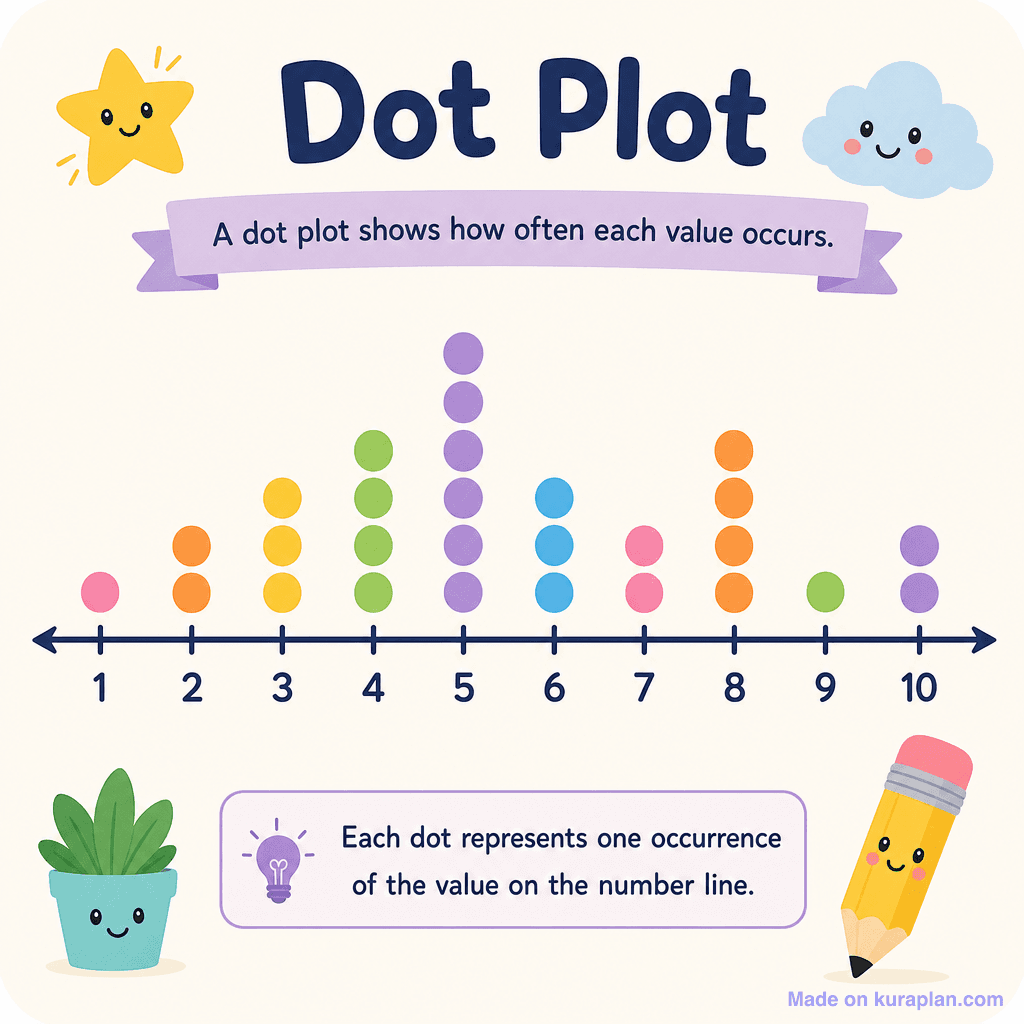
This educational image depicts a colorful, cartoon-style illustration of a dot plot, a fundamental concept in mathematics for data representation. The graph features a horizontal number line from 1 to 10, with stacked colored dots above each number indicating frequency. Text elements include the title 'Dot Plot', a banner stating 'A dot plot shows how often each value occurs.', and a thought bubble explaining 'Each dot represents one occurrence of the value on the number line.' The illustration also includes decorative, friendly characters such as a smiling star, cloud, potted plant, and pencil. This visual is well-suited for classroom slides or worksheets to introduce primary and elementary students to data interpretation and graphing.
How to use
- 1Right-click the image and choose “Save image as”, or use the download button.
- 2Use it in your classroom worksheets, slides or printables — free under CC BY-NC 4.0.
- 3Attribute as “Image by Kuraplan” or link back to kuraplan.com. Not for commercial resale.
Make worksheets with images like this
Kuraplan's editor has the full image library built in — drag-and-drop into a worksheet in seconds.
Browse by subject
15 subjects · 2,247 free illustrations

Cross-Curricular
580 free illustrations

Science
424 free illustrations

Geography
352 free illustrations
English
327 free illustrations

Religious Education
140 free illustrations
Music
108 free illustrations

Health
102 free illustrations

Drama
58 free illustrations

Art
56 free illustrations

History
43 free illustrations

social_studies
21 free illustrations
tech
16 free illustrations

pe
14 free illustrations

te_reo_maori
5 free illustrations

languages
1 free illustrations