Beaufort Scale Chart — free printable diagram
Free geography resource for teachers · CC BY-NC 4.0
About this illustration
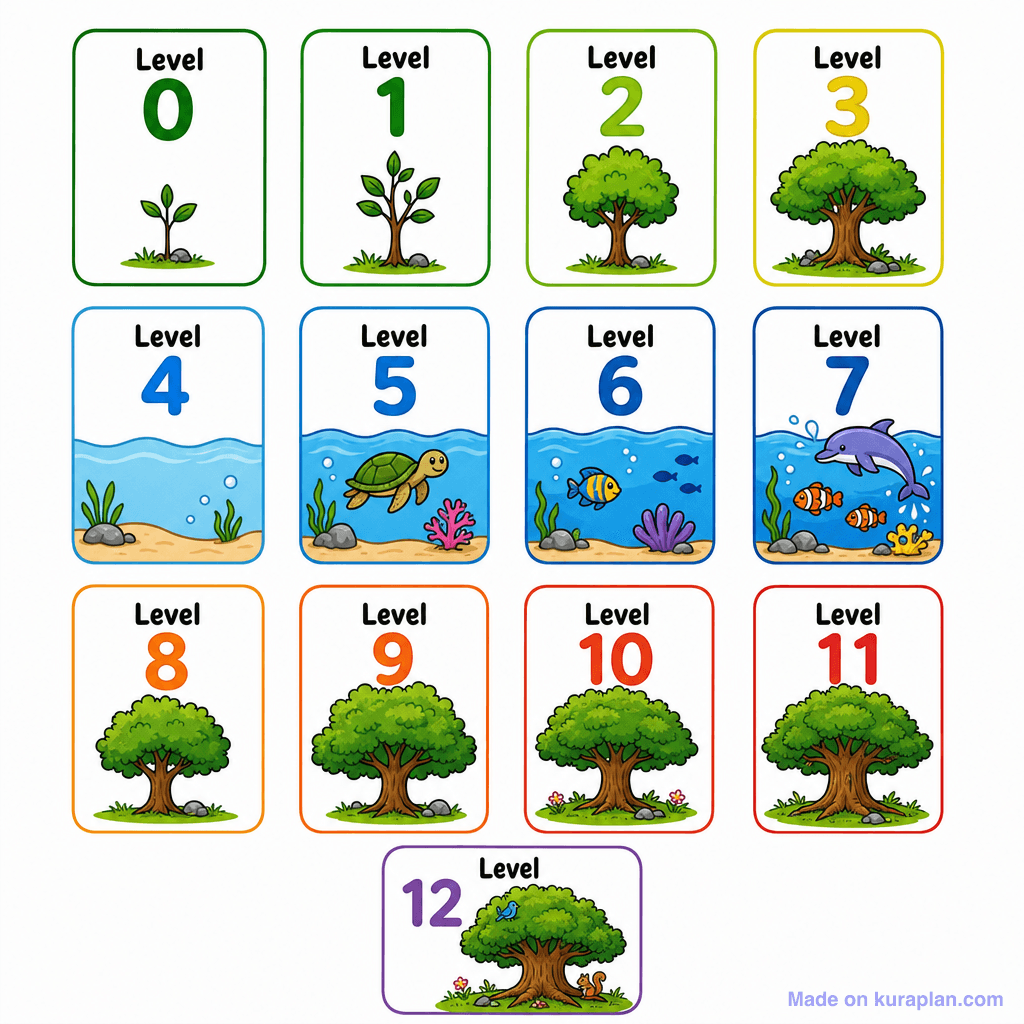
The image displays thirteen rectangular cards, arranged in a grid, each labeled 'Level' followed by a number from 0 to 12. Cards for Levels 0, 1, 2, 3, 8, 9, 10, 11, and 12 depict the progressive growth of a tree, starting from a small seedling and culminating in a large, mature tree with accompanying elements like a bird and squirrel. Cards for Levels 4, 5, 6, and 7 illustrate an underwater environment that gradually fills with marine life, including seaweed, a turtle, various fish, a dolphin, and coral. This visual sequence is ideal for teaching concepts of growth, life cycles, or as a tracking system for student progress in educational activities or games. The cartoon-style illustrations make it suitable for a wide range of classroom activities, such as slide presentations, digital rewards, or printable progress charts.
How to use
- 1Right-click the image and choose “Save image as”, or use the download button.
- 2Use it in your classroom worksheets, slides or printables — free under CC BY-NC 4.0.
- 3Attribute as “Image by Kuraplan” or link back to kuraplan.com. Not for commercial resale.
Make worksheets with images like this
Kuraplan's editor has the full image library built in — drag-and-drop into a worksheet in seconds.
Related illustrations
More from Weather & Climate


Browse by subject
18 subjects · 5,159 free illustrations
Maths
1,912 free illustrations
Cross-Curricular
839 free illustrations

Science
818 free illustrations
English
625 free illustrations

Health
201 free illustrations
social_studies
178 free illustrations
Religious Education
140 free illustrations
Music
130 free illustrations
Art
66 free illustrations
Drama
56 free illustrations
social_sciences
48 free illustrations
History
47 free illustrations
arts
26 free illustrations
pe
25 free illustrations

te_reo_maori
24 free illustrations

tech
16 free illustrations
culture
7 free illustrations

languages
1 free illustrations