Grade 9 Linear Relations Unit
Understanding relationships between variables MPM1D - Principles of Mathematics (Academic) Ontario Curriculum Aligned
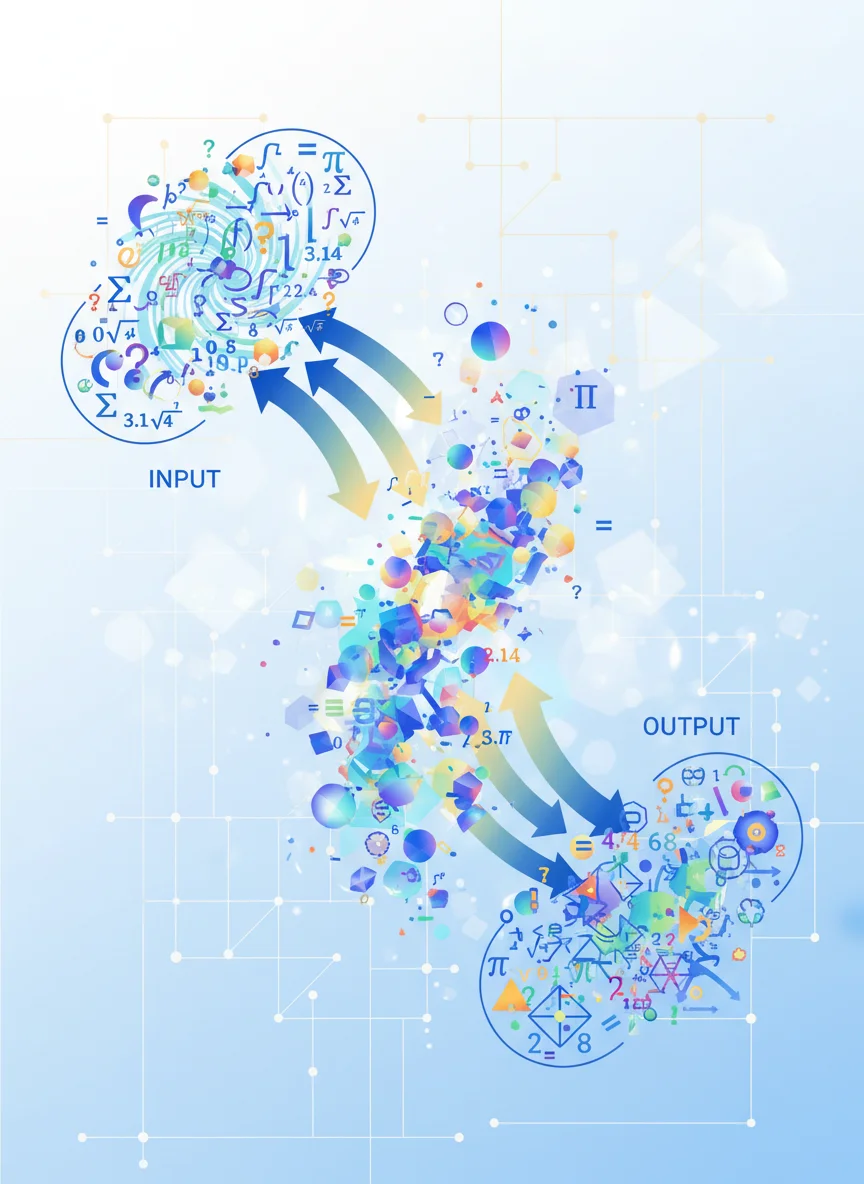
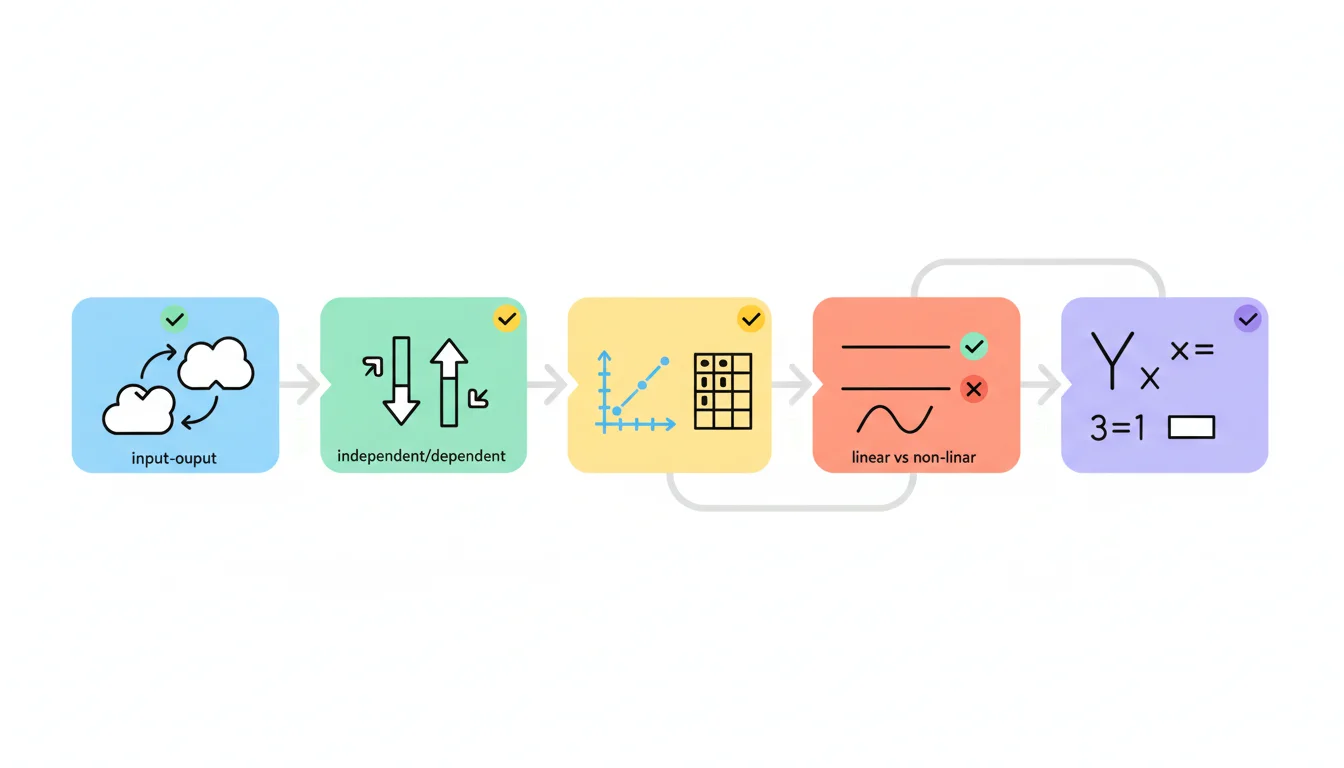
What is a Relation?
A relationship between two sets of elements Connects inputs to outputs Can be shown using ordered pairs, tables, or graphs Example: Hours studied → Test scores

Identifying Variables
Read each scenario carefully Identify which variable is INDEPENDENT (you can control) Identify which variable is DEPENDENT (depends on the other) Example: Time exercising (independent) → Calories burned (dependent)
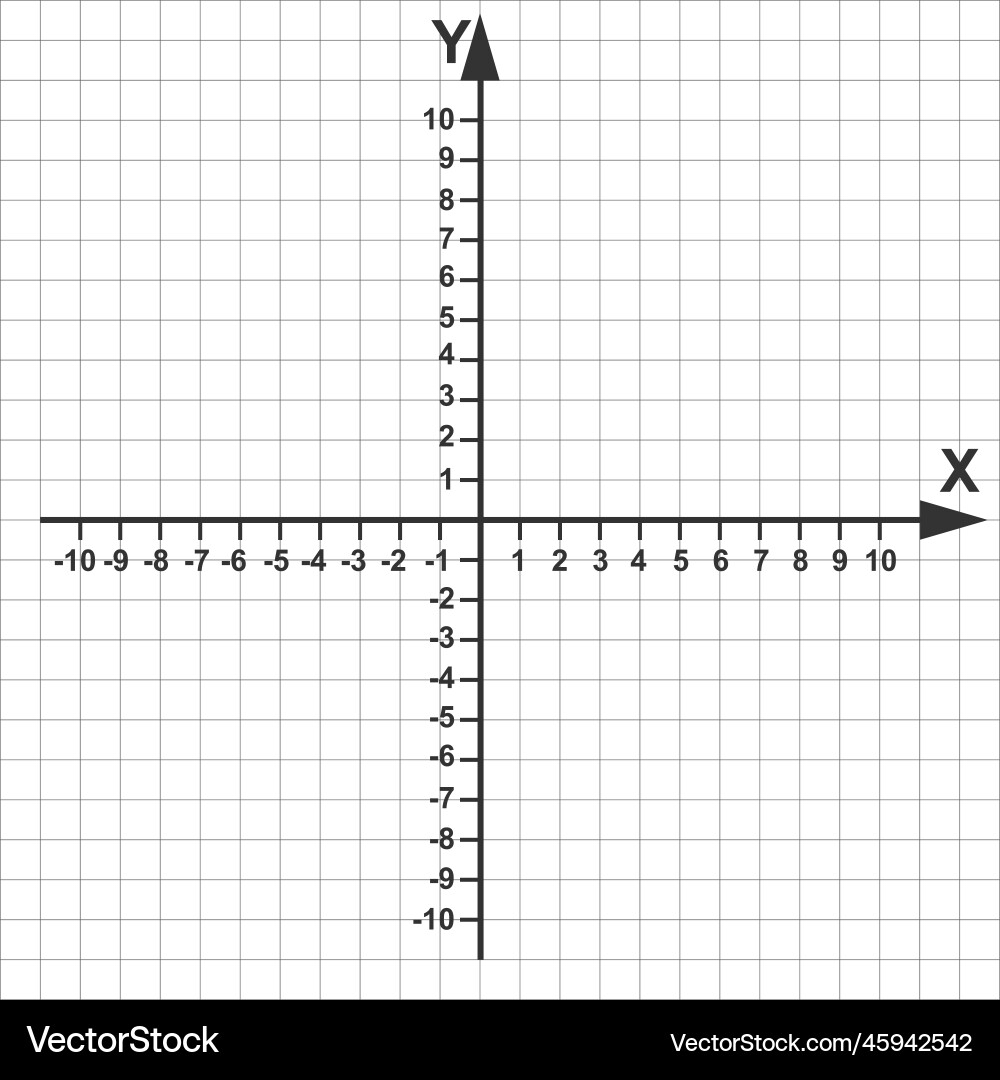
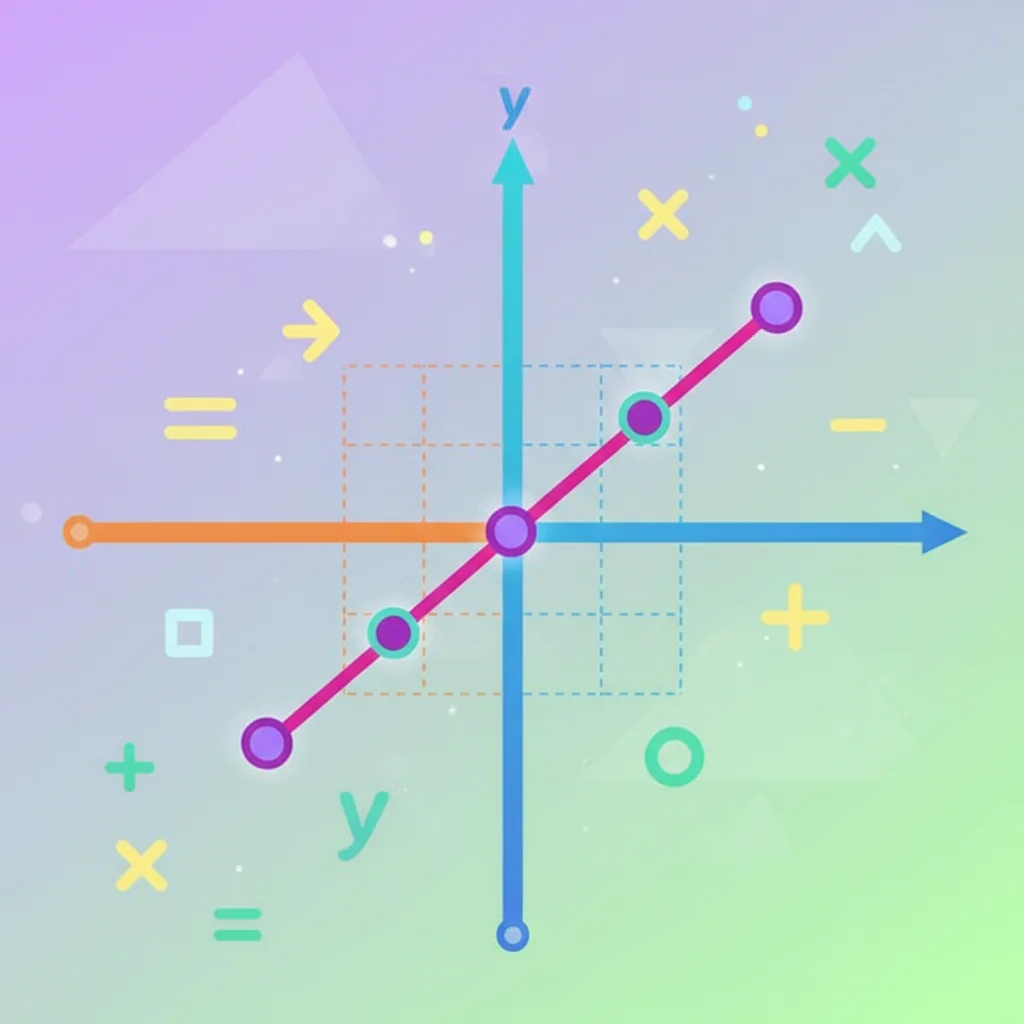
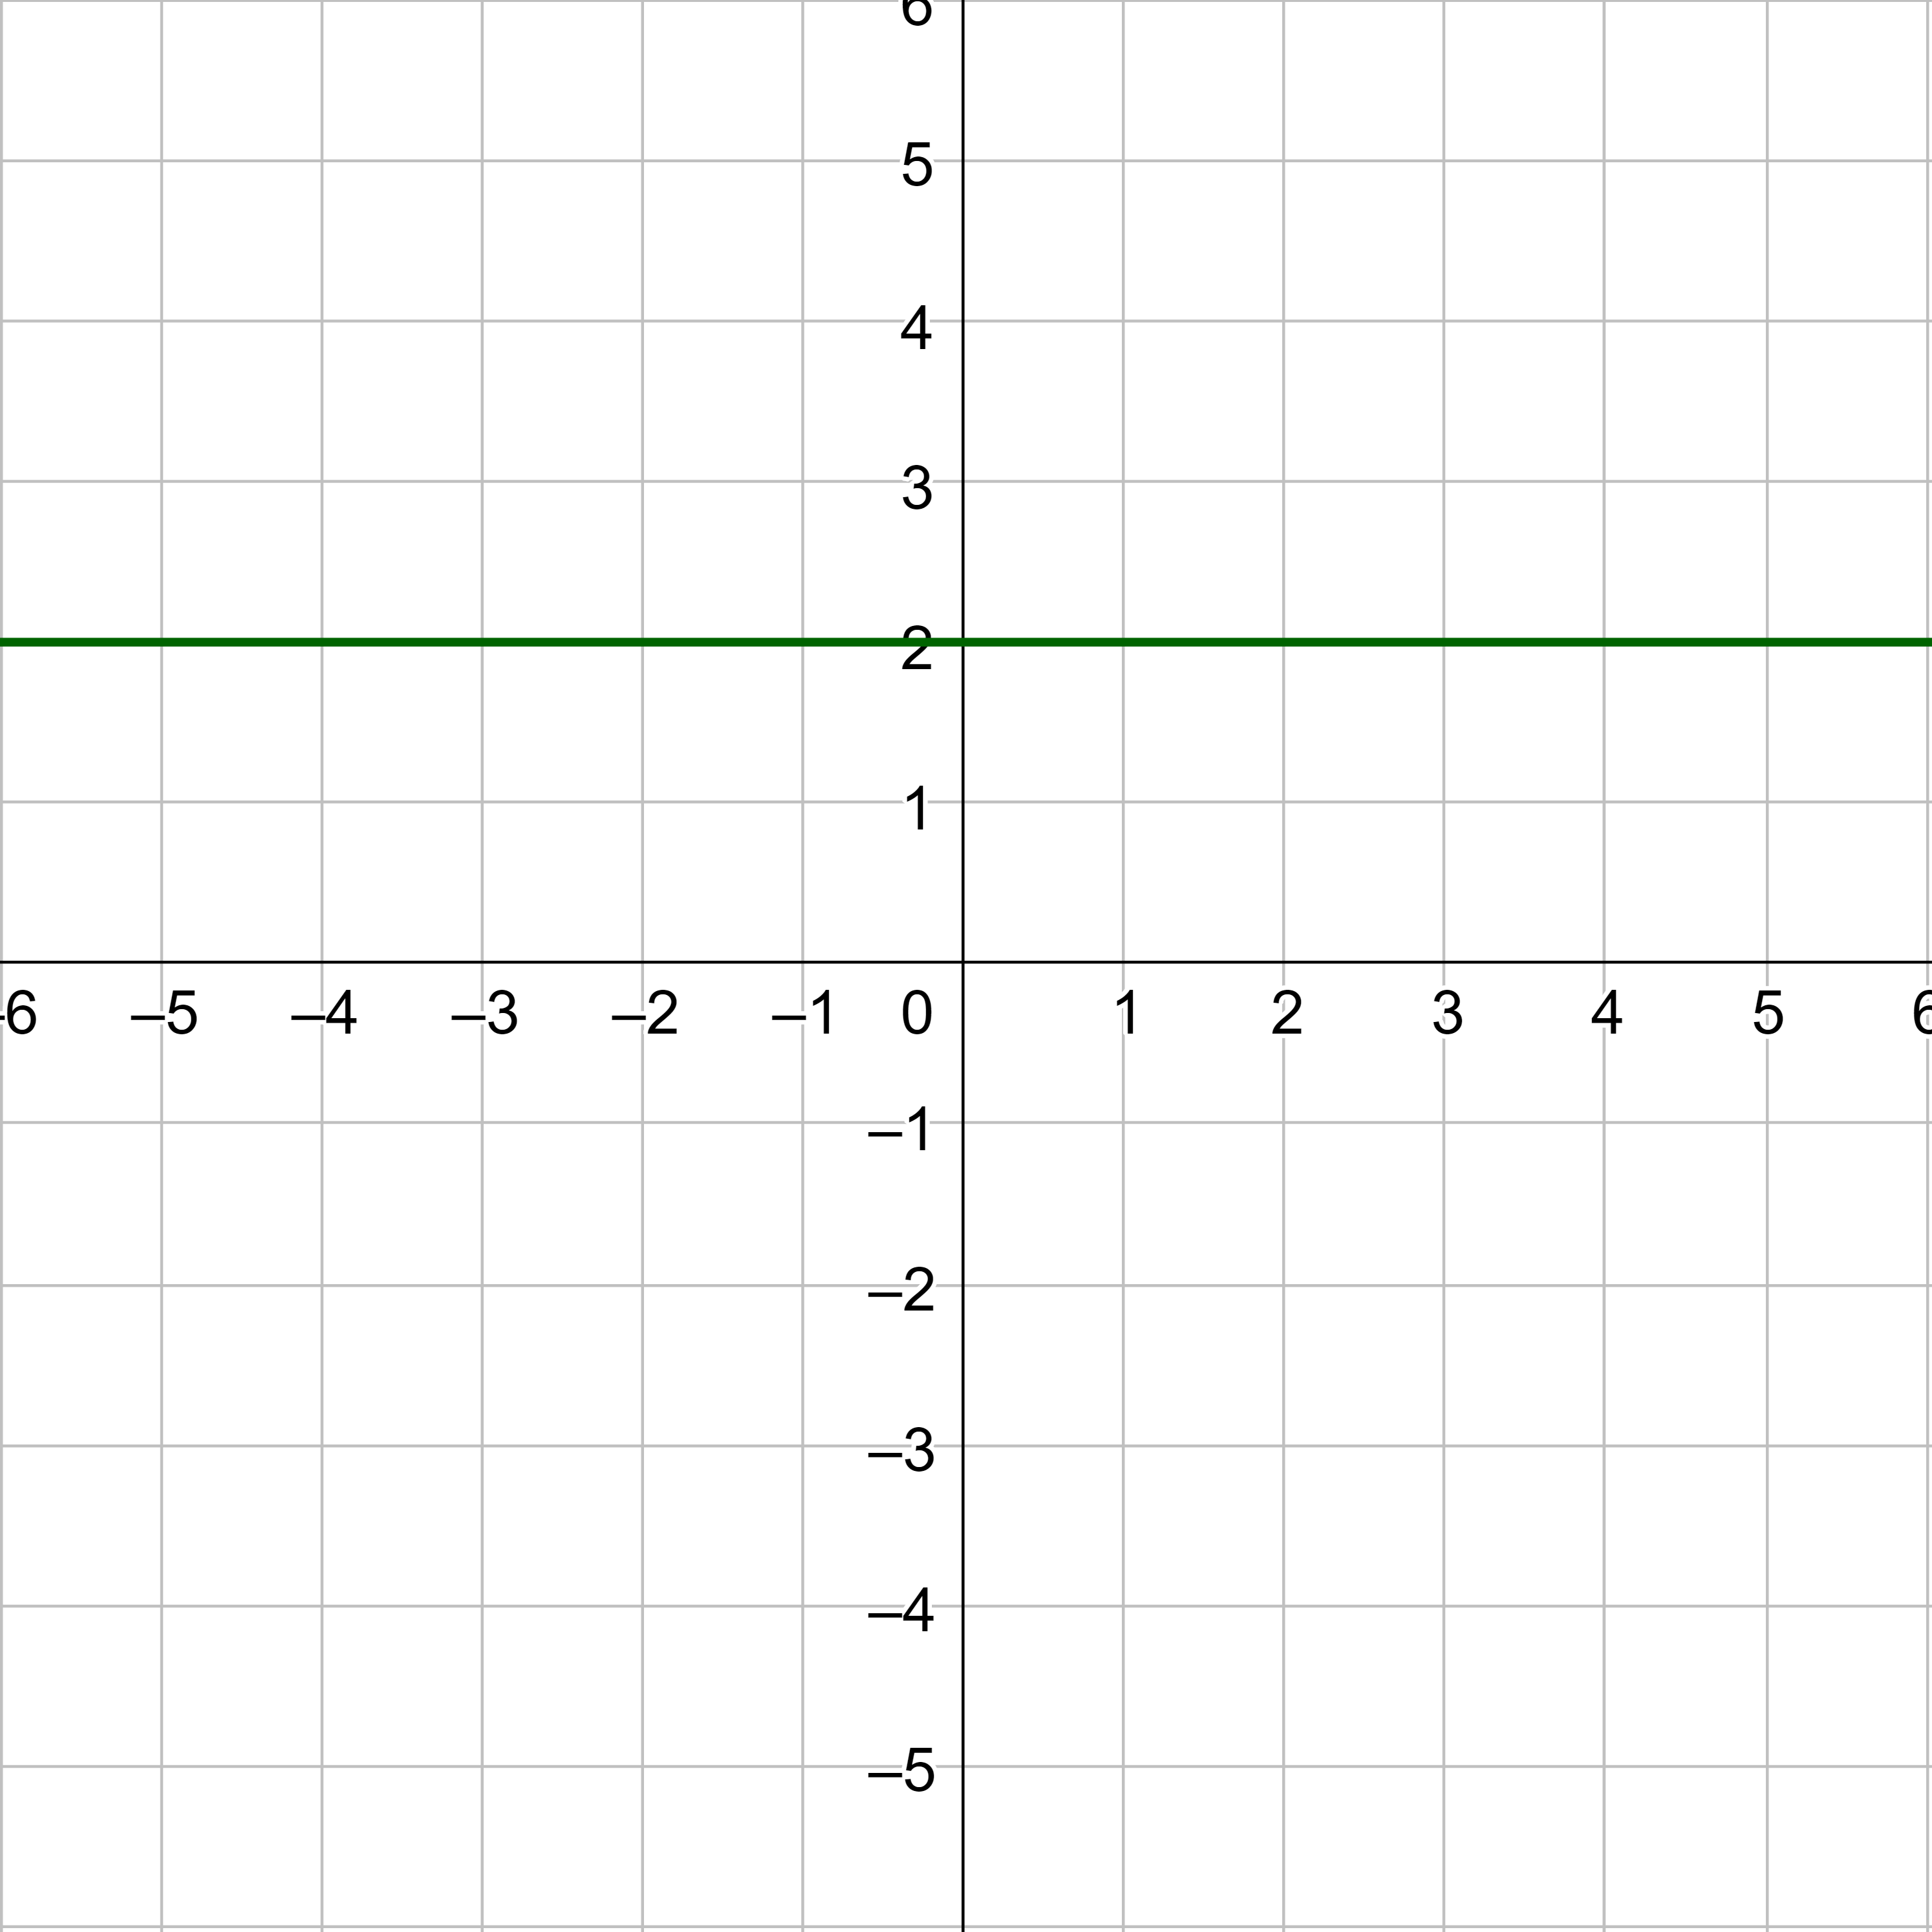
Tables and Graphs
Tables organize data in rows and columns Graphs show relationships visually on coordinate plane X-axis shows independent variable Y-axis shows dependent variable Each ordered pair (x,y) becomes a point on the graph
Linear vs. Non-Linear Relations
{"left":"Forms a straight line when graphed\nHas a constant rate of change\nRate of change is the same between any two points\nExample: y = 2x + 1","right":"Forms a curved line when graphed\nRate of change varies\nRate of change is different between points\nExample: y = x²"}
Check Your Understanding
Look at this table: x: 1, 2, 3, 4 y: 3, 6, 9, 12 Is this relation linear? What is the constant rate of change?
Writing Linear Equations
Linear equations have the form y = mx + b m represents the slope (rate of change) b represents the y-intercept (starting value) Slope = change in y ÷ change in x Example: If y increases by 3 when x increases by 1, and y = 2 when x = 0, then y = 3x + 2