Flow Charts for Divisibility Rules
Grade 6 Mathematics Exploring Visual Problem-Solving Tools 45 Minutes

Lesson Overview & Curriculum Connections
Learn what flow charts are and how they organize information Create visual representations of divisibility rules Connect to Ontario Mathematics Curriculum 6N04 Develop problem-solving strategies using multiple representations

Learning Goals - I Can Statements
I can explain what a flow chart is and how it helps organize steps I can create a simple flow chart to represent a divisibility test I can follow and explain a flow chart related to divisibility rules I can use flow charts as a problem-solving tool

Success Criteria - How We'll Know We've Learned
I can identify key elements of a flow chart (start/end, decision, action steps) I can create a flow chart that correctly shows the sequence of steps I can present my flow chart and explain the process clearly I can use appropriate symbols and logical connections

Activation & Review - Quick Think
Think about your morning routine What steps do you follow to get ready for school? How do you remember the order of steps? Share with a partner: What helps you follow instructions?
What Are Flow Charts?
A flow chart is a picture that shows the order of steps using symbols They help us organize our thinking and solve problems step by step Used everywhere: cooking recipes, video games, computer programs Makes complex processes easier to understand and follow
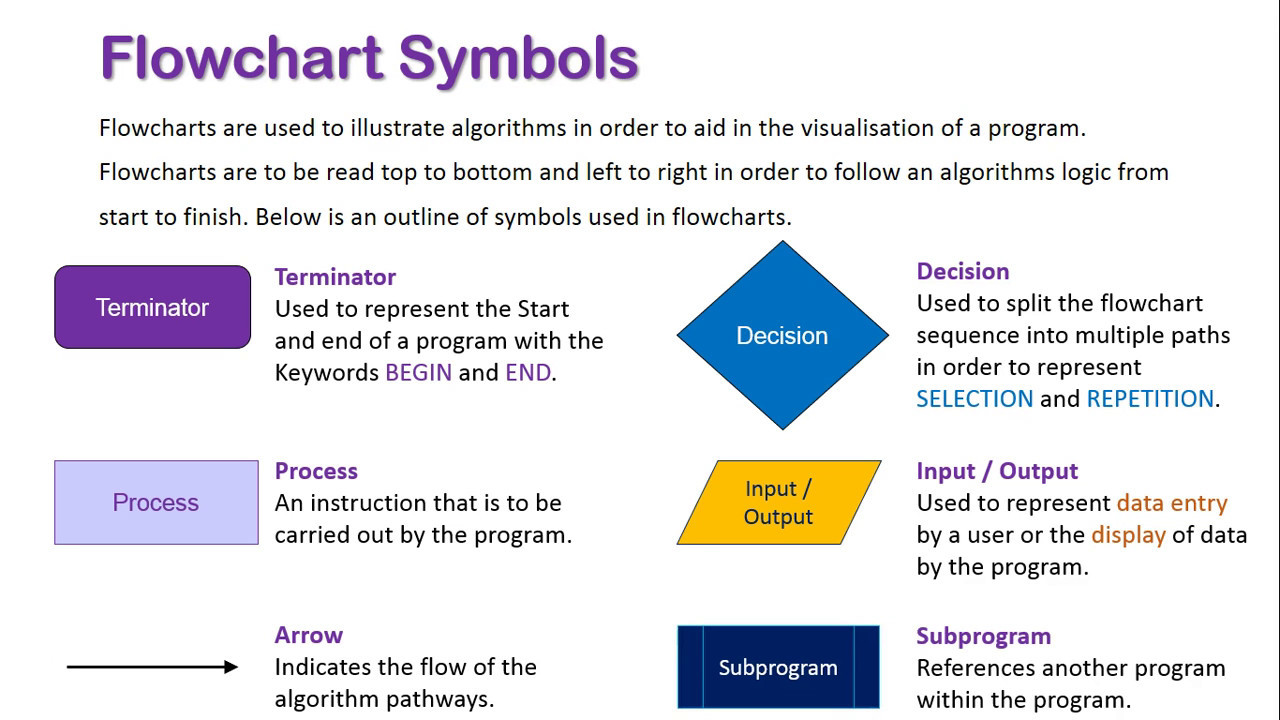
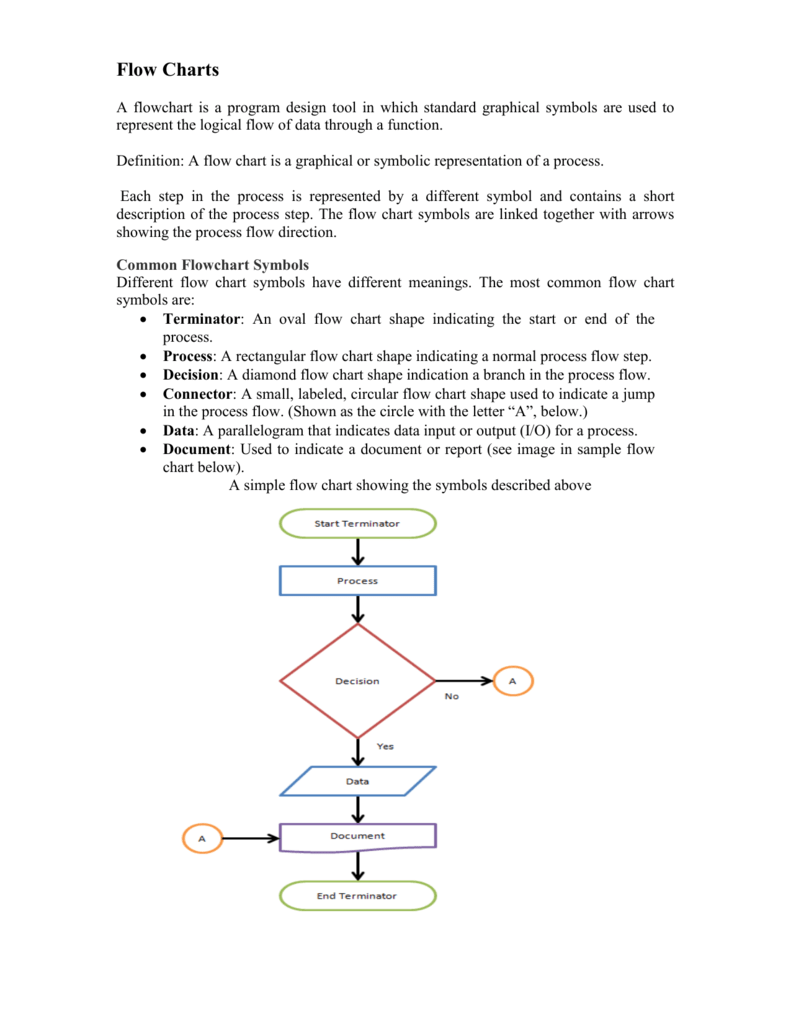
Flow Chart Symbols We'll Use

Modelling: Flow Chart for Divisibility by 2
Start with any number Look at the last digit Is the last digit even? (0, 2, 4, 6, 8) If YES → The number is divisible by 2 If NO → The number is NOT divisible by 2

Guided Practice: Create Flow Chart for Divisibility by 5
Work in pairs Create a flow chart for divisibility by 5 Remember: Numbers divisible by 5 end in 0 or 5 Use the symbols we learned Teacher will circulate to help

Differentiation Support Strategies
Visual templates available for extra support Work at your own pace - quality over speed Ask questions when you need help Movement breaks available as needed Peer support encouraged

Sharing & Reflection
Present your flow chart to the class Explain each step clearly What symbols did you use and why? How does your flow chart help solve the problem? Give positive feedback to your classmates

Summary & Next Steps
Flow charts help us organize mathematical thinking We can use symbols to show steps and decisions Divisibility rules become clearer with visual representation Homework: Create a flow chart for divisibility by 3 Next class: Digital flow chart tools and more complex rules