Two-Way Tables Worksheet
A free maths worksheet ready for your classroom. Open in Kuraplan to grab the print-ready PDF, customize it for your students, or generate a fresh version in seconds.

Two-Way Tables Worksheet
🎯 Success Criteria - Check your understanding!
By the end of this lesson, I can:
📊 Part 1: Constructing Two-Way Tables
Data: Male-Football, Female-Basketball, Male-Cricket, Female-Netball, Male-Football, Female-Basketball, Male-Basketball, Female-Netball, Male-Cricket, Female-Football, Male-Football, Female-Basketball, Male-Basketball, Female-Netball, Male-Cricket, Female-Basketball, Male-Football, Female-Netball, Male-Basketball, Female-Basketball, Male-Cricket, Female-Football, Male-Football, Female-Netball, Male-Basketball, Female-Basketball, Male-Cricket, Female-Basketball, Male-Football, Female-Netball
Complete the two-way table below:
Answer: ____________
Answer: ____________
🎲 Part 2: Calculating Probabilities
Use the two-way table below showing students' favourite fruit by year level:
| Apples | Oranges | Bananas | Total | |
|---|---|---|---|---|
| Year 9 | 8 | 12 | 5 | 25 |
| Year 10 | 15 | 6 | 9 | 30 |
| Total | 23 | 18 | 14 | 55 |
✏️ Part 3: Analysis and Explanation
My question:
Solution:
About This Worksheet
Free in Kuraplan
Sign up free, grab the PDF, and customize it for your class.
Print-Ready
Formatted for standard paper. Clean layout, easy to read.
AI-Generated
Created with Kuraplan's AI, designed for real classroom use.
For Teachers & Parents
Use in classrooms, for homework, tutoring, or homeschool.
Need a custom version of this worksheet?
Kuraplan's AI generates custom worksheets in seconds — differentiated for every learner, aligned to your curriculum.
Generate Custom Worksheets — FreeMore Maths Worksheets
Year 4 Maths Placement Test
Free
Functional Skills Maths Revision
Free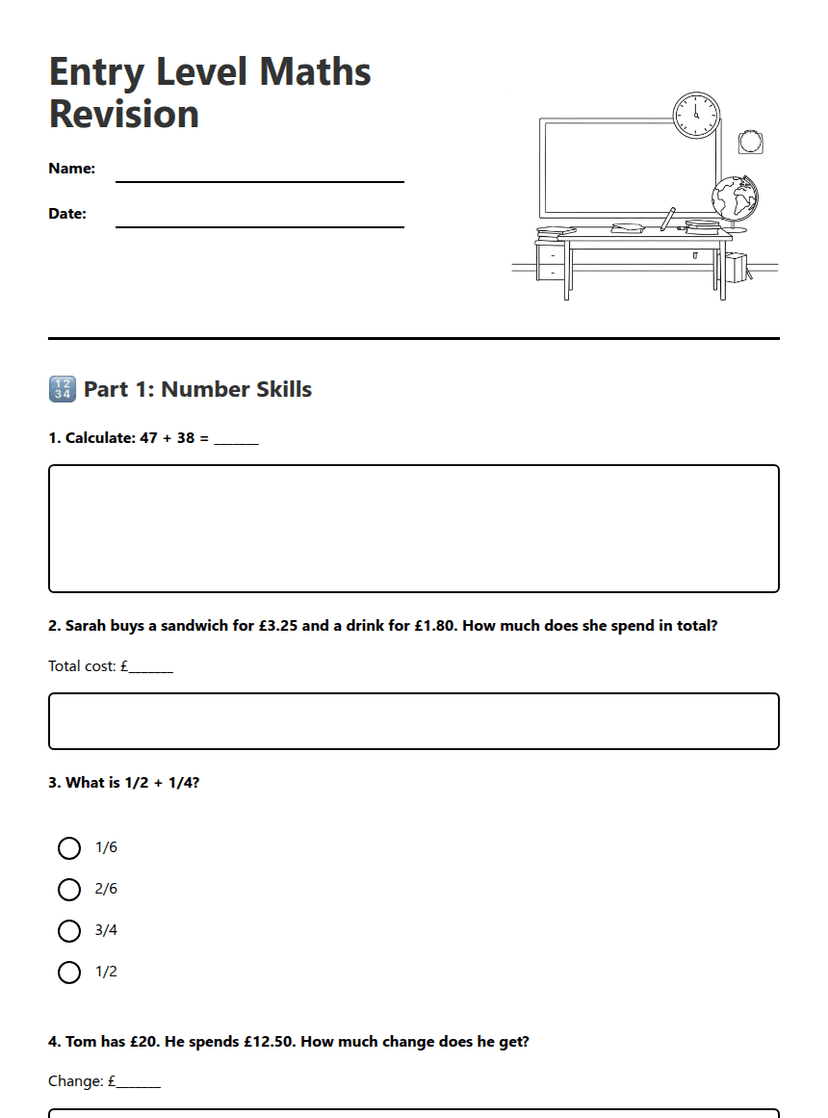
Entry Level Maths Revision
Free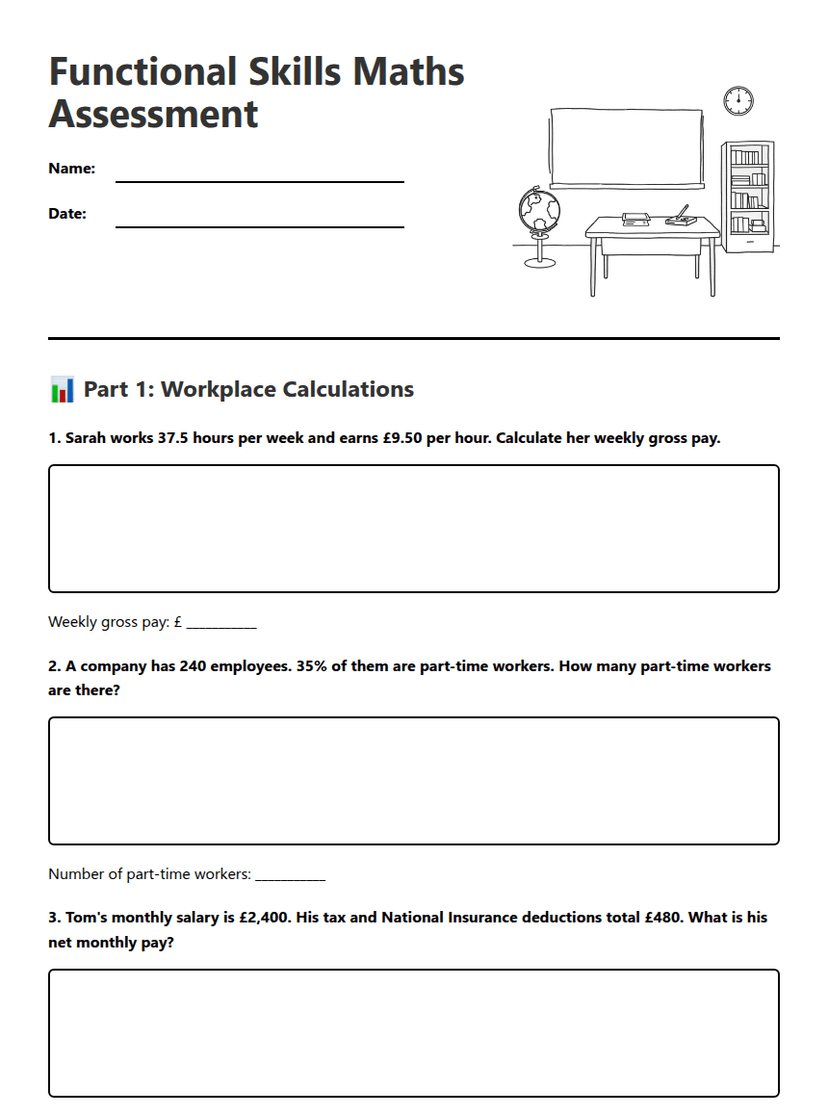
Functional Skills Maths Assessment
Free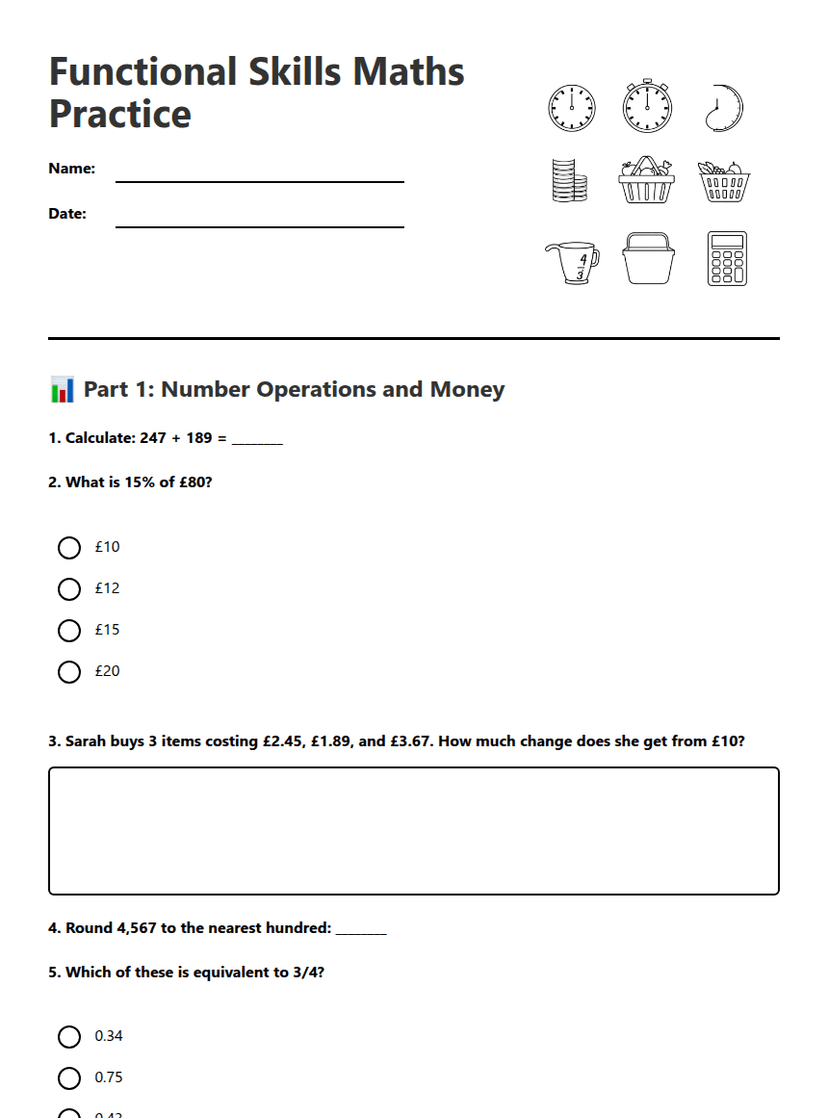
Functional Skills Maths Practice
Free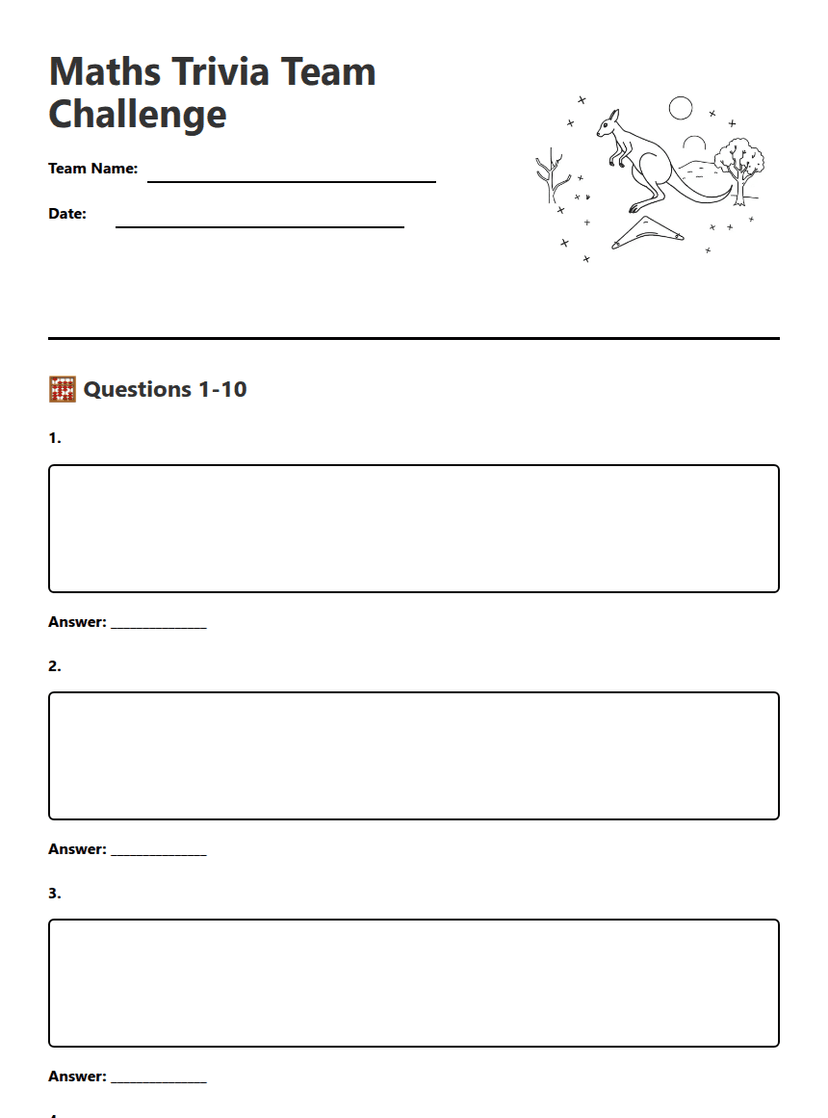
Maths Trivia Team Challenge
Free
Year 9 Maths Revision
Free