Food Sales Line Graph
A free mathematics worksheet ready for your classroom. Open in Kuraplan to grab the print-ready PDF, customize it for your students, or generate a fresh version in seconds.
Food Sales Line Graph
📊 Part 1: Reading the Line Graph
Food Sales Data (2019-2023)
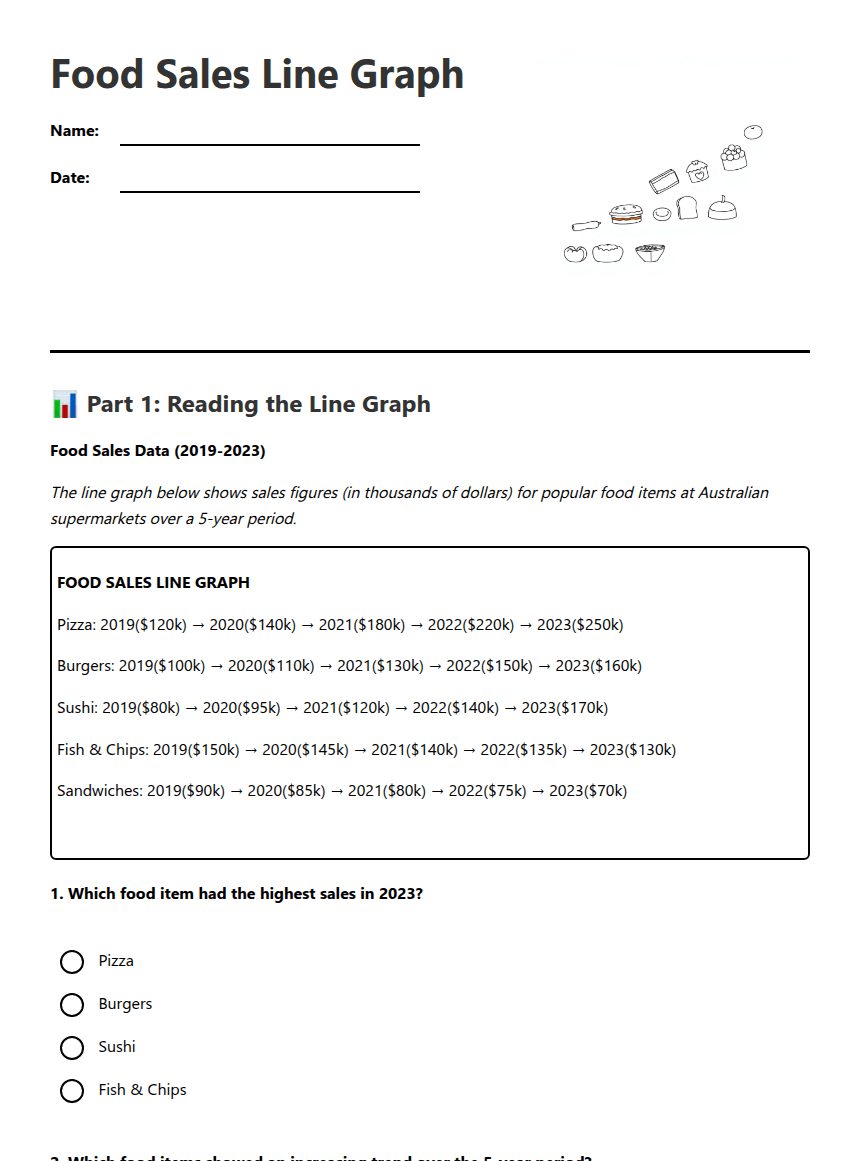
The line graph below shows sales figures (in thousands of dollars) for popular food items at Australian supermarkets over a 5-year period.
FOOD SALES LINE GRAPH
Pizza: 2019($120k) → 2020($140k) → 2021($180k) → 2022($220k) → 2023($250k)
Burgers: 2019($100k) → 2020($110k) → 2021($130k) → 2022($150k) → 2023($160k)
Sushi: 2019($80k) → 2020($95k) → 2021($120k) → 2022($140k) → 2023($170k)
Fish & Chips: 2019($150k) → 2020($145k) → 2021($140k) → 2022($135k) → 2023($130k)
Sandwiches: 2019($90k) → 2020($85k) → 2021($80k) → 2022($75k) → 2023($70k)
Answer: _____________
📈 Part 2: Data Analysis
1st: ________________
2nd: ________________
3rd: ________________
4th: ________________
5th: ________________
🎯 Part 3: Critical Thinking
About This Worksheet
Free in Kuraplan
Sign up free, grab the PDF, and customize it for your class.
Print-Ready
Formatted for standard paper. Clean layout, easy to read.
AI-Generated
Created with Kuraplan's AI, designed for real classroom use.
For Teachers & Parents
Use in classrooms, for homework, tutoring, or homeschool.
Need a custom version of this worksheet?
Kuraplan's AI generates custom worksheets in seconds — differentiated for every learner, aligned to your curriculum.
Generate Custom Worksheets — Free