ATSI Health Bar Graph
A free mathematics worksheet ready for your classroom. Open in Kuraplan to grab the print-ready PDF, customize it for your students, or generate a fresh version in seconds.
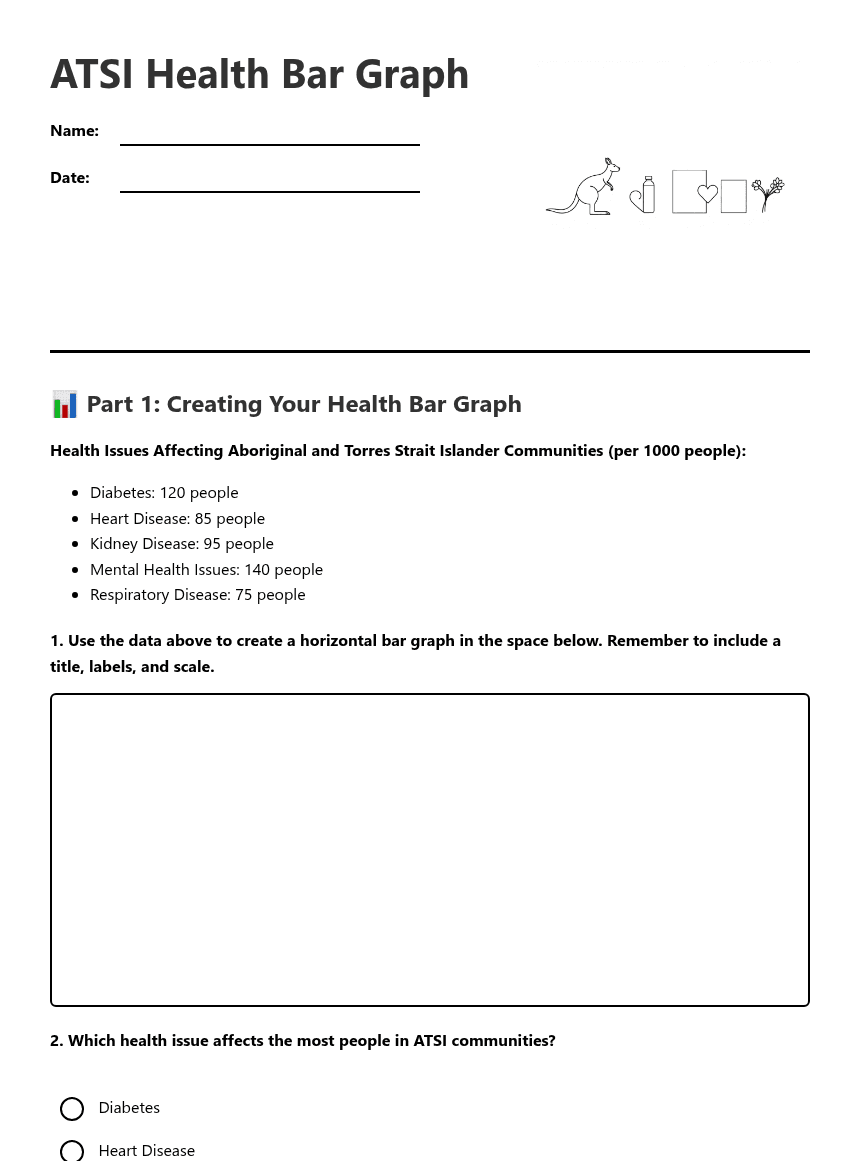
ATSI Health Bar Graph

📊 Part 1: Creating Your Health Bar Graph
Health Issues Affecting Aboriginal and Torres Strait Islander Communities (per 1000 people):
- Diabetes: 120 people
- Heart Disease: 85 people
- Kidney Disease: 95 people
- Mental Health Issues: 140 people
- Respiratory Disease: 75 people
🔍 Part 2: Analysing Health Data
Most common: ___________________
Second: ___________________
Third: ___________________
Fourth: ___________________
Least common: ___________________
💭 Part 3: Reflection
About This Worksheet
Free in Kuraplan
Sign up free, grab the PDF, and customize it for your class.
Print-Ready
Formatted for standard paper. Clean layout, easy to read.
AI-Generated
Created with Kuraplan's AI, designed for real classroom use.
For Teachers & Parents
Use in classrooms, for homework, tutoring, or homeschool.
Need a custom version of this worksheet?
Kuraplan's AI generates custom worksheets in seconds — differentiated for every learner, aligned to your curriculum.
Generate Custom Worksheets — Free