
When Data Lies to Us
Understanding Misleading Data Year 6 Mathematics Critical Thinking with Statistics

What is Data?
Think about information you see every day Numbers, charts, graphs around us How do we use data to make decisions?

Data is Everywhere!
Weather forecasts and temperatures Sports scores and player statistics School test results and grades Video game scores and achievements Social media likes and followers

Why Might Data Lie?
Sometimes data is presented incorrectly People might want to convince us of something Mistakes can happen when collecting information The way data is shown can change what we think

Spot the Problem!
Look at this ice cream sales chart What do you notice about the scale? Does this chart tell the truth? Discuss with your partner

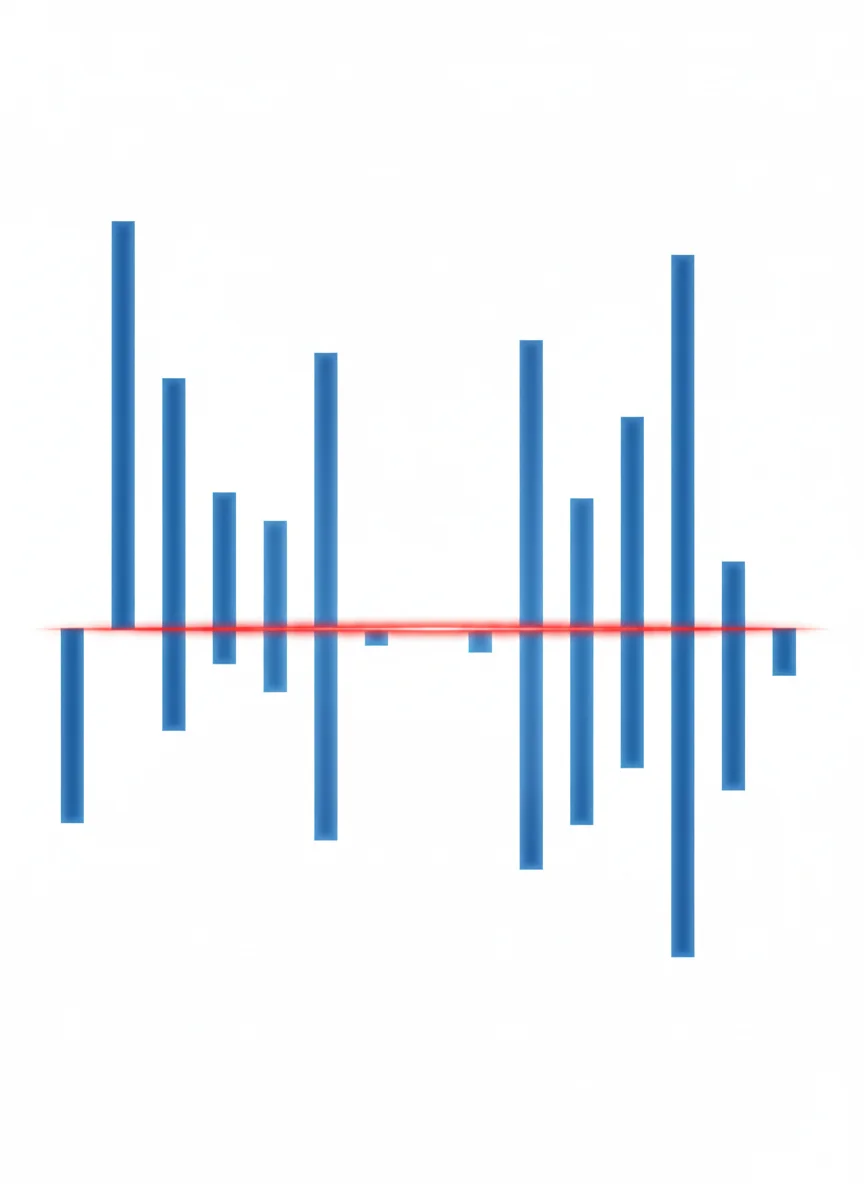
Trick 1: Broken Y-Axis
When charts don't start at zero Small differences look huge Always check the numbers on the side Ask: What's the real difference?

Create Your Own Misleading Chart
Use this class test data: Alex: 85%, Sam: 87%, Jordan: 89% Make a chart that makes the differences look huge Then make an honest version
Trick 2: Cherry-Picking Data
Only showing data that supports your point Leaving out important information Like only showing your best test scores! Always ask: What's missing?

Complete vs. Cherry-Picked Data
{"left":"Team A wins: Monday, Wednesday, Friday\nTeam A loses: Tuesday, Thursday, Saturday, Sunday","right":"Cherry-picked headline: 'Team A Dominates This Week!'\nComplete story: Team A actually lost more games"}

Trick 3: Confusing Correlation and Causation
Just because two things happen together doesn't mean one causes the other Ice cream sales and drowning both increase in summer Does ice cream cause drowning? No! Hot weather causes both to increase

Correlation Detective
Examine these pairs: More homework = Better grades Taller students = Better at basketball More video games = Lower test scores Which might be true correlation? Which might be false?
Trick 4: Misleading Averages
Average can hide the real story Class average: 80% sounds good But what if scores were: 100%, 100%, 100%, 20%, 20%? Most students failed, but average looks fine!
2 more slides available after you open the deck.
Download all 14 slides