Graphing Linear Equations Made Easy
Year 10-11 Mathematics 70 minutes Australian Curriculum Aligned

Learning Intentions & Success Criteria
Apply the x and y table method to graph linear equations Interpret graphs of linear equations in context Successfully complete a table of values for any linear equation Plot points accurately on the Cartesian plane Draw straight line graphs representing equations

Pre-Activation: Quick Table Challenge
Given equation: y = 2x + 1 Complete this table with 3 coordinate pairs Choose your own x values Calculate the corresponding y values Be ready to share your coordinates!
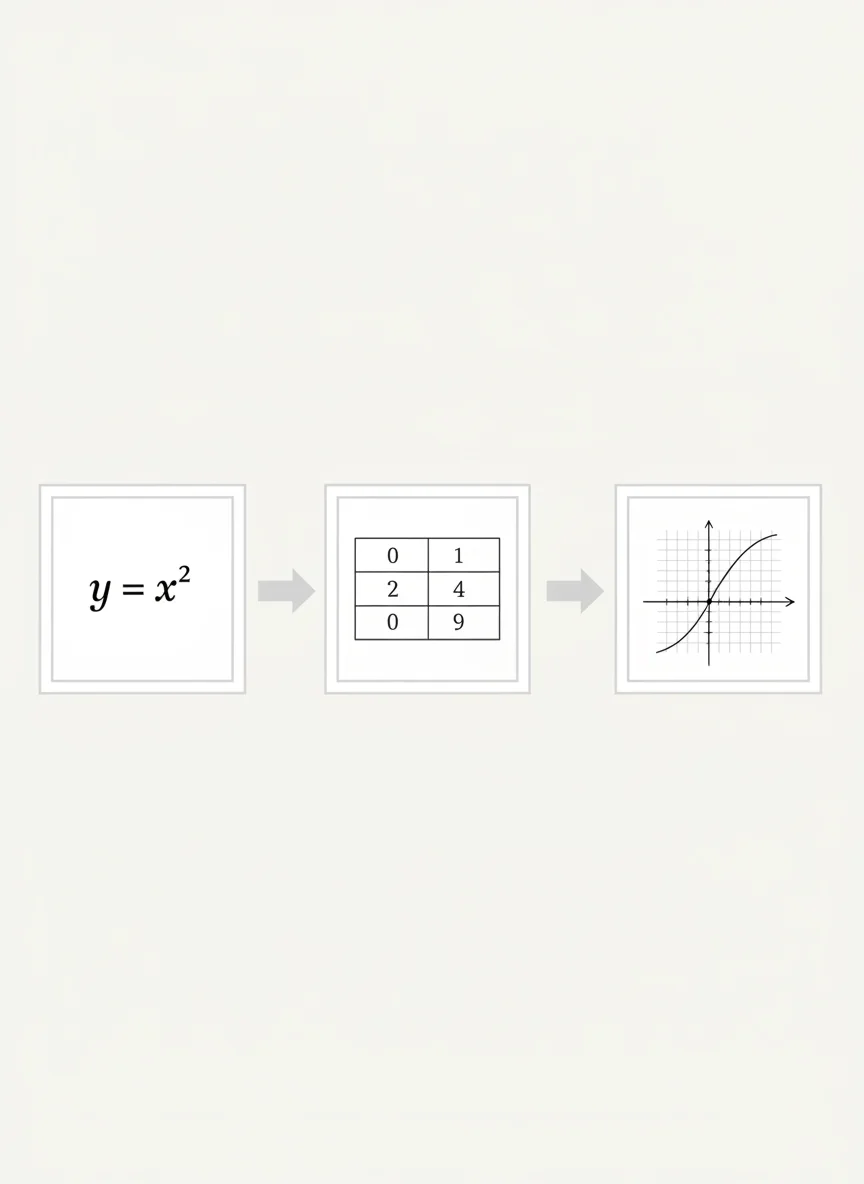
The X and Y Method: Step-by-Step
Step 1: Choose at least 3 x values (include negative, zero, positive) Step 2: Substitute each x value into the equation Step 3: Calculate the corresponding y values Step 4: Create coordinate pairs (x, y) Step 5: Plot points on the Cartesian plane Step 6: Connect points with a straight line

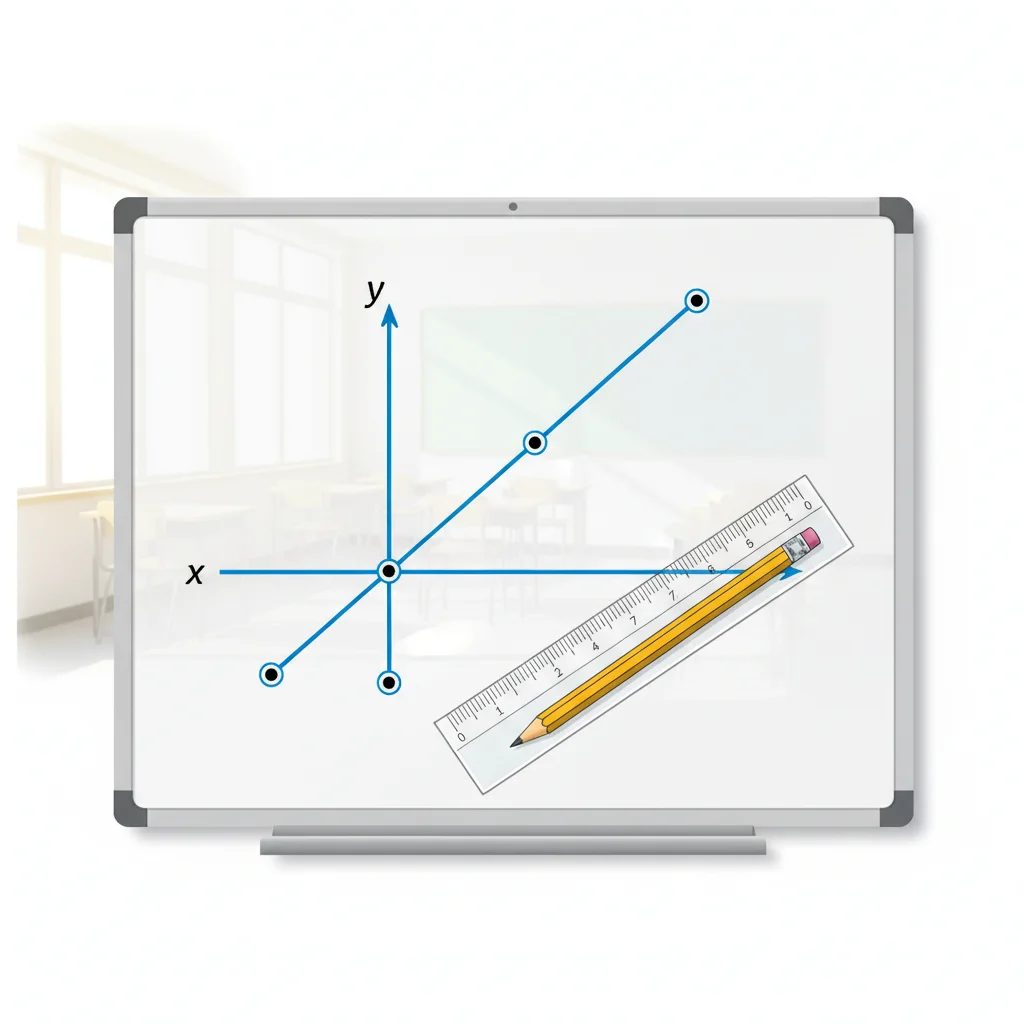
Teacher Demonstration: y = -x + 3

Guided Practice: Let's Do It Together
New equation: y = 3x - 2 As a class, choose x values together Calculate y values step by step Everyone plots the same points Draw your line and compare with neighbors

Think-Pair-Share
Why do we choose at least 3 x values? What would happen if we only used 2 points? How can we check if our points are correct? Discuss with your partner, then share with the class

Independent Practice Time
Your equation: y = 0.5x + 4 Work individually or with a partner Complete your table of values Plot points accurately on graph paper Draw and label your line Check your work by testing one point

Exit Ticket Challenge
Graph the equation: y = -2x + 5 Show your table of values Plot at least 3 accurate points Draw your final line Submit before leaving class
Lesson Reflection & Next Steps
Today we mastered the table method for graphing linear equations This skill connects algebra to visual representation Next lesson: Exploring slope and y-intercept Keep your graphs as reference materials Practice makes perfect - try the homework problems!